Welcome back to our local traders following the Australia Day public holiday. I hope you had a relaxing day, celebrating in whichever way you see fit.
But the show that is world markets stops for nobody and yesterday saw some of the mixed swings that we have become accustomed to in 2016. The Shanghai Composite Index (China’s major stock index) fell to a 13 month low, with a 6.4% decline at the close. The US S&P 500 put in a nice up day, continuing the market’s bounce off its weekly trend line that we have been speaking about.
Finally, a quick overnight recap wouldn’t be complete without a look at WTI Crude Oil, and yet more premature calls of a bottom. Did WTI have an up day? Yes. Did WTI break any resistance levels? No. Is there any conviction or momentum in this SINGLE DAY’s buying? No. Just make sure you continue to see these moves for what they are.
Fundamental Decoupling Between China and Risk?:
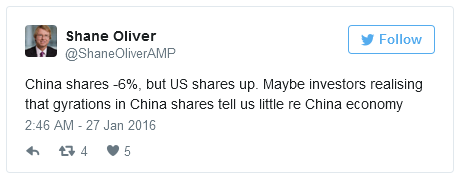
The disconnect between the falls in Chinese stock markets and the rally in US stocks combined with a continued appetite for risk currencies poses some interesting questions. Shane Oliver, head of Investment Strategy and Chief Economist at AMP Capital put it best when I was flicking through Twitter this morning:

The stock market isn’t always the best indication of the economic health of a country. And a planned, emerging economy’s stock market which is notorious for manipulation and artificial strength/weakness isn’t always the best indication of the risk appetite across Forex markets. Any removal of correlations between Chinese stocks and world market sentiment is to me common sense being shown by traders. While the sensationalism that the headlines provide is sometimes pretty to look at, taking a step back is in fact the correct approach.
The flow of capital out of the Chinese economy has become a major problem. According to Bloomberg Intelligence data, the total outflow figure of $1 trillion USD for 2014 was seven times higher than the previous year. A problem of perception as much as anything, with a snowball effect gathering over time as the perception becomes a self fulfilling prophecy if you will.
When Chinese officials start publicly challenging George Soros, you know things are about to get real. This came from a front page opinion piece by a commerce ministry researcher in the overseas edition of the People’s Daily under the headline: “Declaring war on China’s currency? Ha ha!” (Yes, that was a real headline!):
“Soros’s war on the renminbi and the Hong Kong dollar cannot possibly succeed — about this there can be no doubt.”
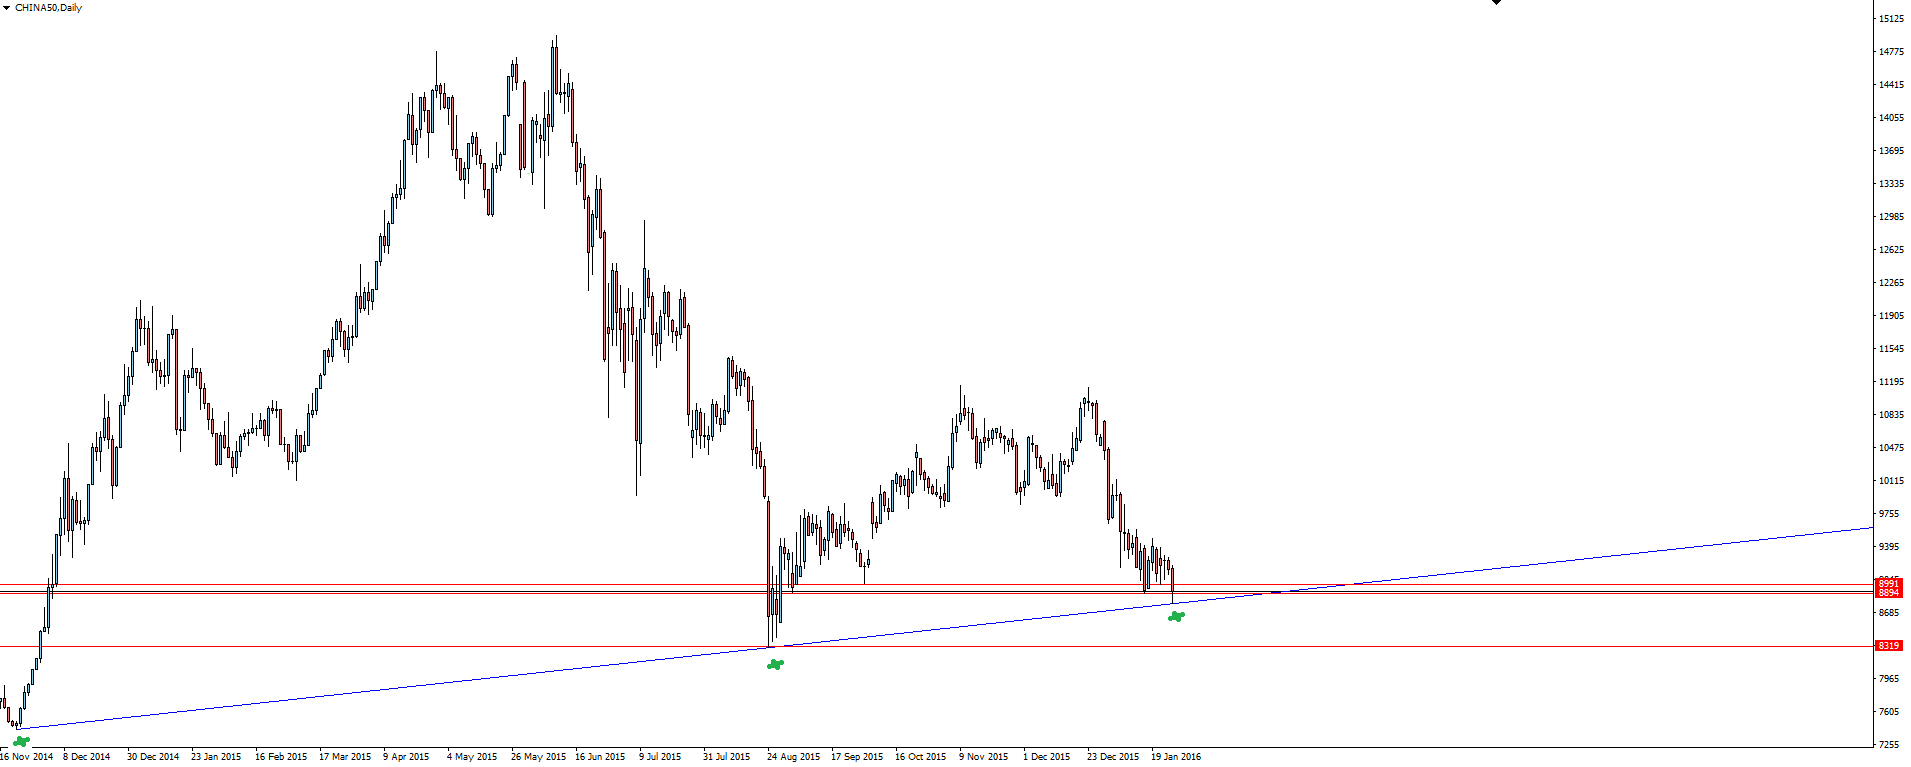
CHINA50 Daily:
The CHINA50 daily has seen price drop back down to test major daily trend line support independently of its US SP500 cousin. Just how decoupled the markets have become will be tested by this major support level that for now indicates the correlation is still there.
Next 24 Hours:
Early tomorrow morning before I will have published the Daily Market Update, we will have seen the US FOMC and RBNZ both deliver monetary policy decisions. With the Fed having started a rate raising cycle and the RBNZ’s easing cycle still in full swing, the two could not be any more different.
Chart of the Day:
It is the kiwi where the most action could be reasonably expected, with economists expecting the RBNZ to hold, but another cut a huge possibility.
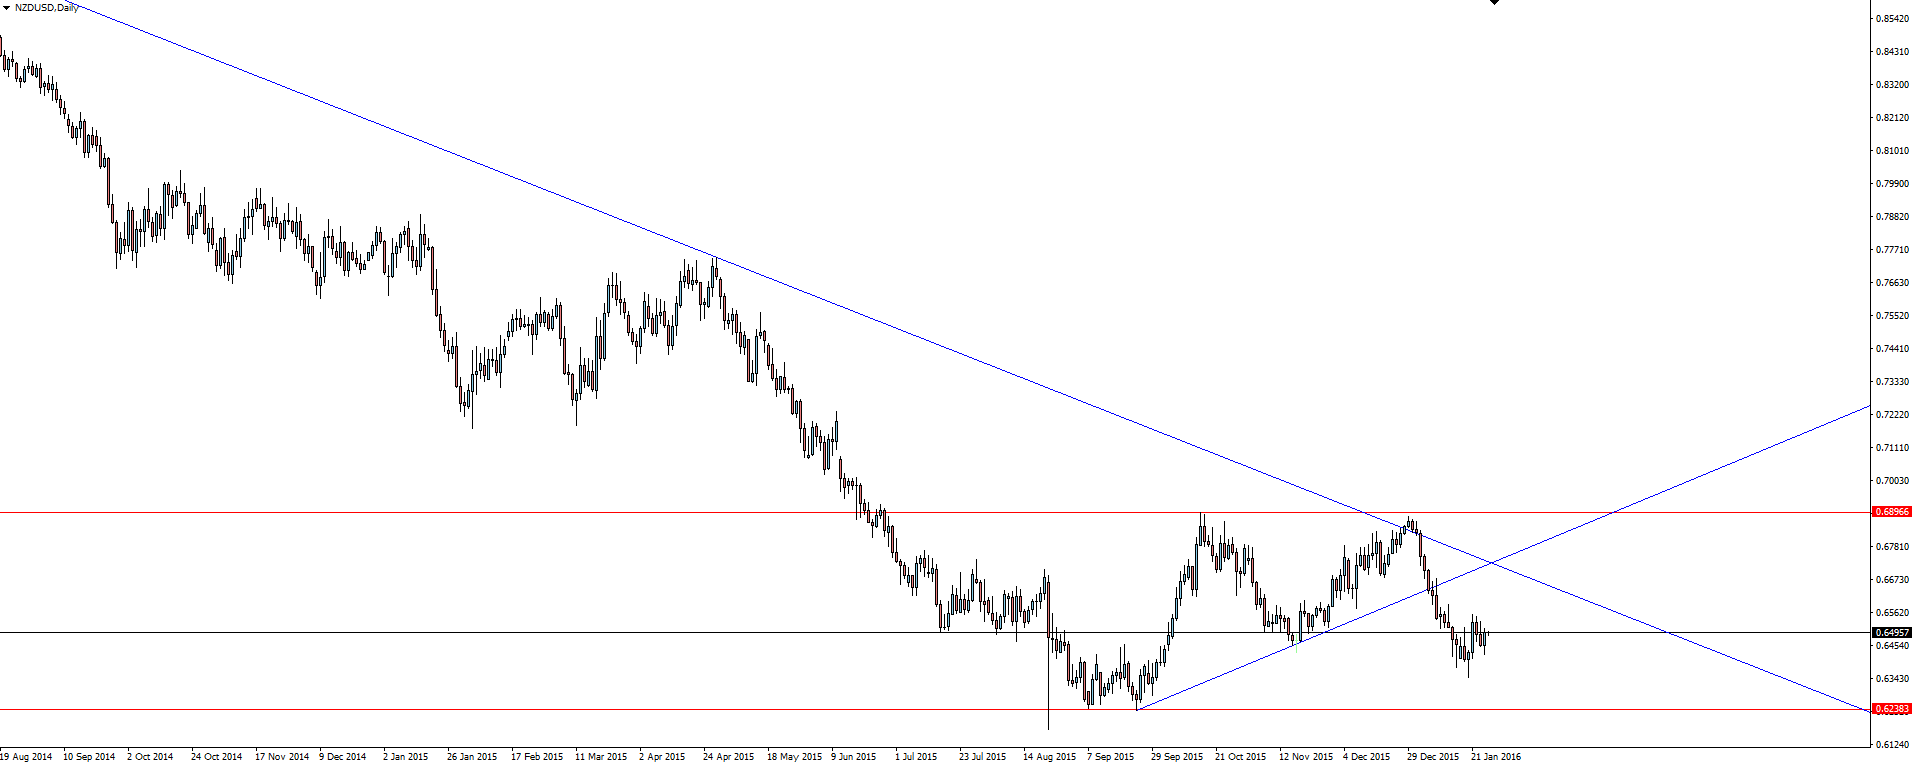
NZD/USD Daily:
Technically we are in the middle of sideways, range-bound trading, but the overall bearish trend and current re-test of short term previous support now as resistance makes me lean toward the short side into the decision.
Remember that moves around these two decisions are going to be about meeting market expectations. On which side to you see the greatest risk for a big move? Identify this and trade from the opposite.
On the Calendar Wednesday:
AUD CPI q/q
AUD Trimmed Mean CPI q/q
USD New Home Sales
USD Crude Oil Inventories
USD FOMC Statement
USD Federal Funds Rate
Risk Disclosure: In addition to the website disclaimer below, the material on this page prepared by MT4 Forex broker Vantage FX Pty Ltd does not contain a record of our prices or solicitation to trade. All opinions, news, research, tools, prices or other information is provided as general market commentary and marketing communication – not as investment advice. Consequently any person acting on it does so entirely at their own risk. The experts writers express their personal opinions and will not assume any responsibility whatsoever for the actions of the reader. We always aim for maximum accuracy and timeliness, and MT4 for Mac Forex broker Vantage FX shall not be liable for any loss or damage, consequential or otherwise, which may arise from the use or reliance on this service and its content, inaccurate information or typos. No representation is being made that any results discussed within the report will be achieved, and past performance is not indicative of future performance.
