Forex News and Events:
The European equity markets follow the steep decline in US and Asian sessions. The Volatility S&P 500 spiked to 16.38 in New York yesterday, the focus remains on Q1 earnings pre-weekend. It has clearly been a challenging week for USD and USD holdings. The dissatisfaction on FOMC minutes and the sell-off in dollars favored demand in G10 and soft commodities versus USD. EUR positive sentiment pushed EUR/USD above 1.3900 as Europe walked in this morning, the highest since March 19th (before drop on FOMC meeting & Yellen’s hawkish speech), gold trades above the 21-dma, the Kiwi eases from the fresh high of 0.8746 (Apr 10th).
Euro pays no attention to QE threat
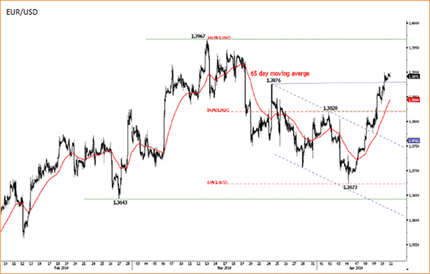
EUR/USD extends gains above 1.3900 in Europe this morning. While the markets fully price out ECB easing threats, the disappointment on FOMC minutes played big in EUR/USD dynamics this week. Across the Euro-zone, the CPI reports showed mixed price direction in Germany, Spain, France and Greece. The Euro-zone official CPI is due next week (Wed, April 16th). The final inflation reading is to confirm the weakness in March expectations in y/y figures (CPI y/y estimate at 0.5%, CPI core at 0.8%). At this stage, we all know ECB has tools for more easing and is ready to act. Yet EUR prices clearly show that not a great majority believes that ECB will use these very tools. Given the disbelief in ECB action, traders’ interest shifts towards higher real interest rates (due to disinflationary /deflationary fears in EZ). In addition the recent appetite in EZ peripheral bonds are EUR-supportive. Spanish 10y government yields hit lowest since 2005, Greece 10y is back at 6%, early 2010 levels before tensions and default had sent Greek 10y yields above 35%. Trend and momentum indicators on EUR/USD chart point upwards. Light option related offers are placed at 1.3910 for today’s expiry, while option bids are waiting to be activated above 1.3950/1.3975 and 1.4000.
The Kiwi hits the target
NZD/USD hit our 0.8745 target on April 10th, boosted by the post-FOMC sell-off in USD. The short-term trend turn neutral from bearish; the MACD will suggest the extension of gains for a daily close above 0.8680. Released this week, the business manufacturing PMI showed faster expansion in March (58.4 in Mar vs.56.2 in Feb). “The manufacturing sector is in a buoyant mood with the total PMI, production and employment indicators all near 10-year highs” stated BNZ. The strength in economic indicators boosts hawkish RBNZ expectations for further rate hike. We remind that the RBNZ has been the first major central bank to step into policy normalization by lifting its policy rate from 2.50% to 2.75% at March meeting. The next RBNZ meeting is due on April 24th, the markets price in a second round of rate hike. Over 15 leading banks to have submitted forecasts to a recent Bloomberg survey, 75% bet in favor of a rate hike to 3.0% by the end of April, one thirds bet for a hike to 3.25% by June. By the second quarter of 2015, half of participants see the RBNZ rate at 4.0%. Given the policy expectations, the Kiwi can only appreciate against USD, subject to the first Fed rate hike by mid-2015 earliest.
NZD/USD recovered from last week’s sell-off on weak dairy auction prices. The short-term trend and momentum indicators recovered from last week’s bearish shift. We revise our next target to 0.8869 (Fibonacci 138.2% projection on Aug-Oct 2013 rally), then 0.8903 (Aug-Oct projection on recovery starting from Feb 4th). AUD/NZD slowly drills the strong resistance at broad downtrend channel base & 100 dma and is likely to close the week at the bullish consolidation zone. The RBNZ/RBA divergence should weigh on the antipodean pair walking towards 1.1000 psychological threshold.

Today's Key Issues (time in GMT):
2014-04-11T12:30:00 USD Mar PPI Final Demand MoM, exp 0.10%, last -0.10%2014-04-11T12:30:00 USD Mar PPI Ex Food and Energy MoM, exp 0.20%, last -0.20%
2014-04-11T12:30:00 USD Mar PPI Final Demand YoY, exp 1.10%, last 0.90%
2014-04-11T12:30:00 USD Mar PPI Ex Food and Energy YoY, exp 1.10%, last 1.10%
2014-04-11T13:55:00 USD Apr P Univ. of Michigan Confidence, exp 81, last 80
The Risk Today:
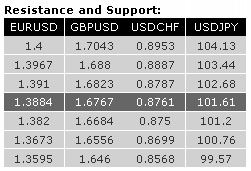
short-term bullish momentum is dominate despite pause, after breaking out of its short-term declining channel and pushing above near term resistance. Monitor the resistance at 1.3820 (see also 50% retracement). Hourly supports now lie at 1.3820 (old resistance) and 1.3673. Another resistance can be found at 1.3876. In the longer term, EUR/USD is still in a succession of higher highs and higher lows, suggesting additional upside can be anticipated. A significant resistance now lies at 1.3876 (24/03/2014 high).
strong bullish run was halted at key resistance 1.6823. The short-term bullish momentum is intact as long as the hourly support at 1.6684 (previous resistance) holds. Another support lies at 1.6556. In the longer term, prices continue to move in a rising channel. As a result, a bullish bias remains favoured as long as the support at 1.6460 holds. A major resistance stands at 1.7043 (05/08/2009 high).
USD/JPY has broken the support at 102.68 (19/03/2014 high), leading to a sharp decline. Even though the support at 101.72 has been breached, prices are now close to a key support between 101.56 (see the rising trendline from 100.76 (04/02/2014 low)) and 100.76 (see also the 200 day moving average). A resistance now stands at 102.68 (previous support). A long-term bullish bias is favoured as long as the key support area given by the 200 day moving average (around 100.80) and 99.57 (see also the rising trendline from the 93.79 low (13/06/2013)) holds. A major resistance stands at 110.66 (15/08/2008 high).
USD/CHF sell-off continues and is now challenging near term support. The weakening momentum has been confirmed by the break of the support implied by the rising trendline. Other hourly horizontal supports stand at 0.8787. Hourly resistances can be found at 0.8887 (intraday high) and 0.8953. From a longer term perspective, the structure present since 0.9972 (24/07/2012) is seen as a large corrective phase. The recent technical improvements suggest weakening selling pressures and a potential base formation. A decisive break of the key resistance at 0.8930 would open the way for further medium-term strength.

