EUR/USD
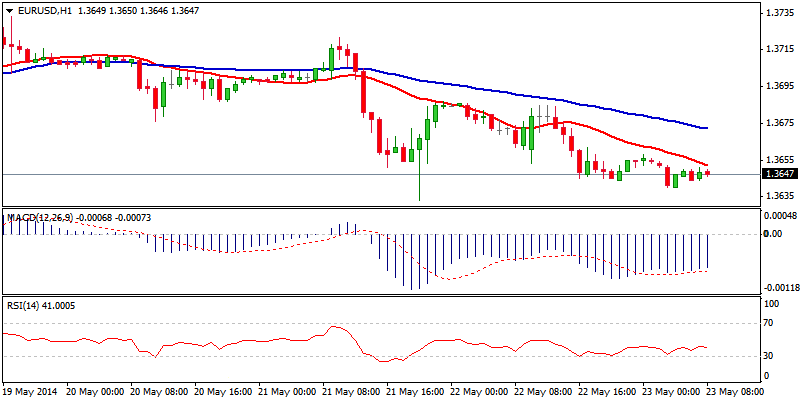
The euro eventually broke below 1.3670 breakpoint, ending a near-term consolidative phase and commencing a fresh leg lower. The price spiked lower to 1.3633 so far, ticks away from the 200SMA, with a subsequent bounce being capped below the 1.37 barrier, a former consolidation floor. This is seen as initial signal of an end of a two-month congestion and a fresh bear-phase that also confirms a double-top formation which could trigger more significant downside as the price action stabilizes below the 1.37 handle. A break below 1.3626, the 200SMA, would confirm a bearish resumption towards the psychological 1.36 support, also the Fibonacci 76.4% of the larger rally from 1.3475 to 1.3992, the lowest and the highest price seen in 2014 so far; with 1.3561, the February lower top, seen in extension. The correction top at 1.3687 offers initial resistance, reinforced by the hourly 55SMA and should, along with the 1.37 hurdle, ideally cap the upside attempts. Only a break above the previous range tops at the 1.3730 zone would sideline immediate bears for a fresh rally towards the strong 1.3773 barrier, the 12/13 / 05 lower tops / Fibonacci 38.2% of 1.3992/1.3633 descend.
Res: 1.3725; 1.3735; 1.3779; 1.3800
Sup: 1.3647; 1.3633; 1.3600; 1.3561
EUR/JPY
The pair corrects off a fresh low at 138.13 as the larger weakness approaches the next target at 138.00. The bounce that cracked the psychological 139 barrier is still seen preceding a fresh leg lower despite the improved hourly technicals, as long as the significant resistance and lower platform at 139.30/40 stays intact. Negative larger timeframe studies remain bearish and see the downside favored. However, caution is required, as a Morning Star pattern is forming on the daily chart, with a daily close above 139.40 required to confirm bottoming and reversal. Otherwise, bears will remain in control, with a break below 138.00, the 200SMA, the trigger for further downside and opening 137.47, the Fibonacci 138.2% expansion of the wave from the 140.90 lower top.
Res: 139.11; 139.40; 139.85; 140.03
Sup: 138.63; 138.38; 138.13; 138.00 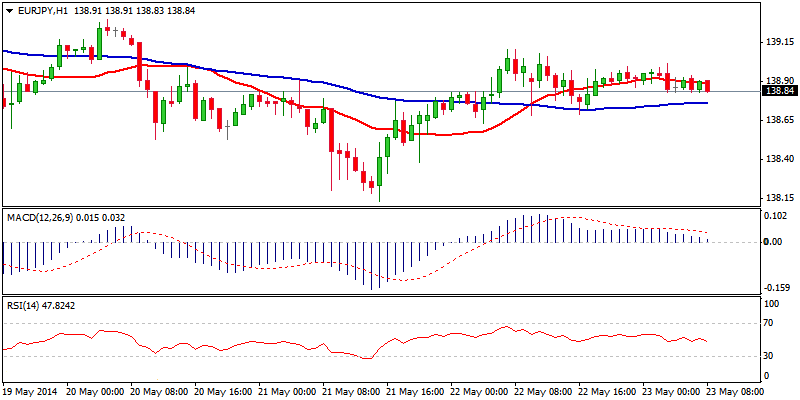
GBP/USD
Cable maintains an overall positive tone, as the rally from 1.6730, the correction low, probed above the 1.69 barrier, with 1.6919, the highest seen so far. A near-term congestion fresh high is under way, with the downside being contained at 1.6855, near the 38.2% retracement of the 1.6730/1.6919 upleg and price action underpinned by the 4-hour 20/55SMA bullish cross. While the latter levels stay intact, fresh upside attempts will remain in play with the price’s move above 1.6919 and a firm break higher required to resume the near-term uptrend from 1.6730 and open the Fibonacci 76.4% at 1.6932, ahead of a lower top at 1.6973 and the psychological 1.7000 barrier in focus. Alternatively, a slide below the 1.6850 support zone would delay bulls.
Res: 1.6902; 1.6919; 1.6932; 1.6973
Sup: 1.6874; 1.6855; 1.6825; 1.6800 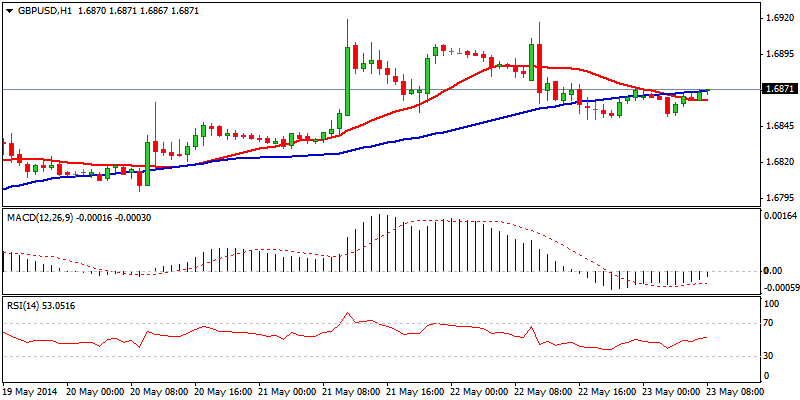
USD/JPY
The pair maintains an overall negative tone as weakness off 102.35, the recovery rejection level, broke below strong supports and the short-term base at the 101.40/20 zone as well as the psychological 101 support. A subsequent bounce to the levels that mark the 61.8% retracement of the 102.32/100.81 downleg signals further hesitation at this important support zone. However, the structure is negative overall and will keep risk towards the downside, as long as the price holds below the 102 barrier, with a clear break below the 101.20 base required to confirm. The near-term target lies at 100.74, the 04 February low. Loss of this would signal a bearish resumption of the larger downtrend from 105.43, the 02 January year-to-date high and focus the psychological 100 support. Extension of the current correction above the 102 handle would delay bears for further sideways trading, while only a break above the larger range top at 103, would provide relief and open way for a stronger recovery.
Res: 101.75; 102.00; 102.11; 102.35
Sup: 101.60; 101.34; 101.10; 100.81 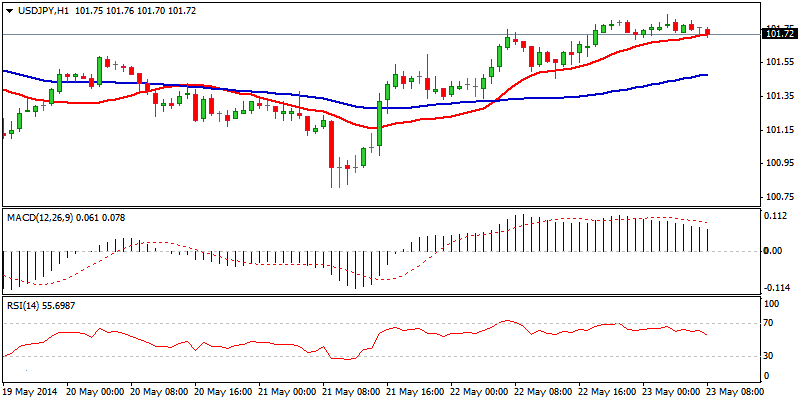
AUD/USD
The pair maintains a negative near-term tone with fresh weakness aiming towards the 0.9200 support as the price fell ticks away from this support. Overall, the picture is negative and looks for further weakness and a full retracement of the 0.9201/ 0.9407 ascent. Support at the 0.92 zone is seen as a breakpoint and in the case of extension lower, would signal an end of the larger consolidation under the fresh peak at 0.9265, the 10 April high, and would trigger a stronger correction of the larger 0.8658/ 0.9460 uptrend. Next supports lie at 0.9172, the 200SMA, ahead of 0.9154, the Fibonacci 38.2% retracement and the 55/200SMA golden cross; with a break here required to confirm the bears are fully in play. A current correction of overextended conditions of lower timeframe studies delays immediate bears for corrective action, with the 0.93 barrier, the previous support and Fibonacci 38.2% of the 0.9407/0.9215 descent, offering the first strong resistance ahead of 0.9330, the Fibonacci 61.8% and previous range floor, where rallies should be limited.
Res: 0.9272; 0.9288; 0.9300; 0.9330
Sup: 0.9255; 0.9207; 0.9200; 0.9172 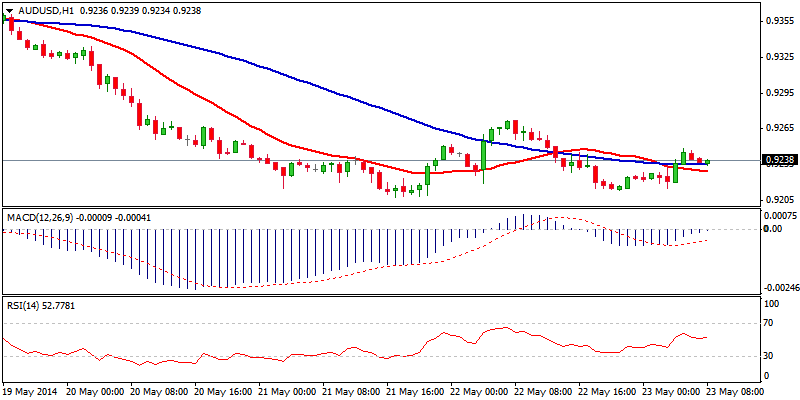
AUD/NZD
The pair’s near-term price action moves higher on a corrective rally off fresh low at 1.0743, improving the near-term picture. The scenario of a near-term bottom and a higher low at 1.0743, the daily 55/100SMA’s bull-cross and fresh strength, is supported by the Morning Doji Star pattern that is forming on a daily chart and requires a daily close above the 1.08 handle for confirmation. A move higher requires an open at the 1.0850 and 1.0874 tops, for a possible final push towards the key 1.0907 barrier. Conversely, a slide below 1.0743 brings bears back in play.
Res: 1.0804; 1.0832; 1.0850; 1.0874
Sup: 1.0767; 1.0743; 1.0730; 1.0700 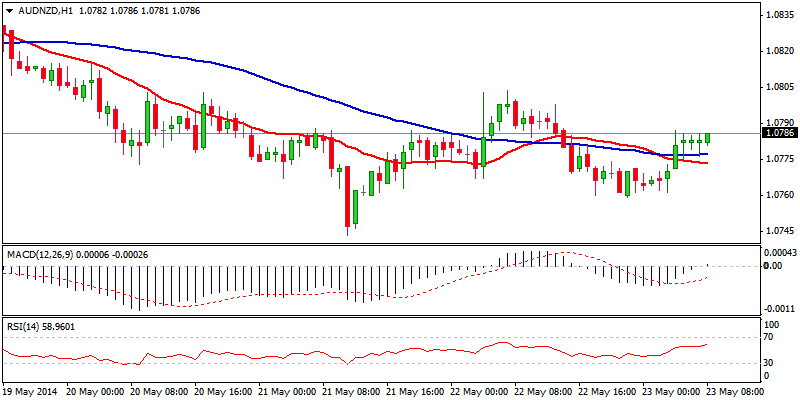
XAU/USD
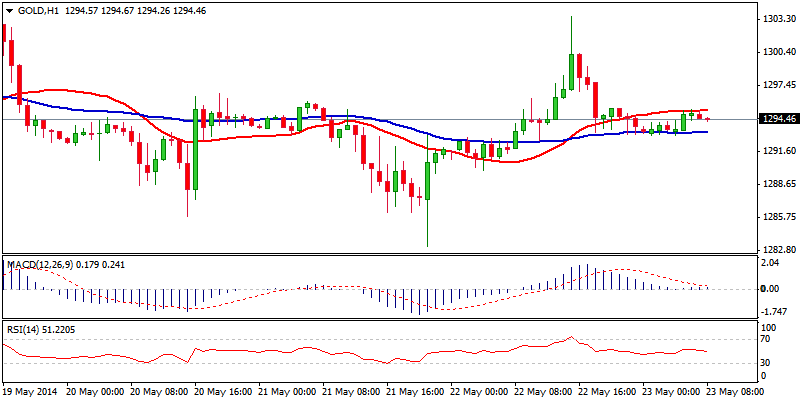
Spot gold remains in near-term sideways mode, trading within a triangular narrowing range consolidation. A fresh attempt through the psychological / 200SMA 1300 barrierdid not succeed as yet, as the price holds below the triangle’s upper boundary at 1303 and recent peak at 1308, posted on 14 May. The latter marks the first pivot, with a break here required to signal further recovery and open the next important barrier and range top at 1315, the peak of 05 May. Studies on lower timeframe charts are neutral and see no direction for now. A sustained break above the 1300 barrier is seen as an initial step for possible further upside, with a break higher to confirm the scenario. Otherwise, holding below the 1300 handle would trigger further weakness. A clear break below 1285/83, the recent lows and triangle support, would confirm the bearish resumption and open 1277/73, ahead of key support at 1268, the 24 April low.
Res: 1296; 1300; 1305; 1309
Sup: 1285; 1283; 1277; 1273 