The markets moved into a risk on mode on Friday following Draghi's ECB comments from the day before. The economic calendar today is relatively light. The Australian markets are closed while German Ifo business climate and a speech by ECB President Draghi are key events to look forward to today.
EUR/USD Daily Analysis

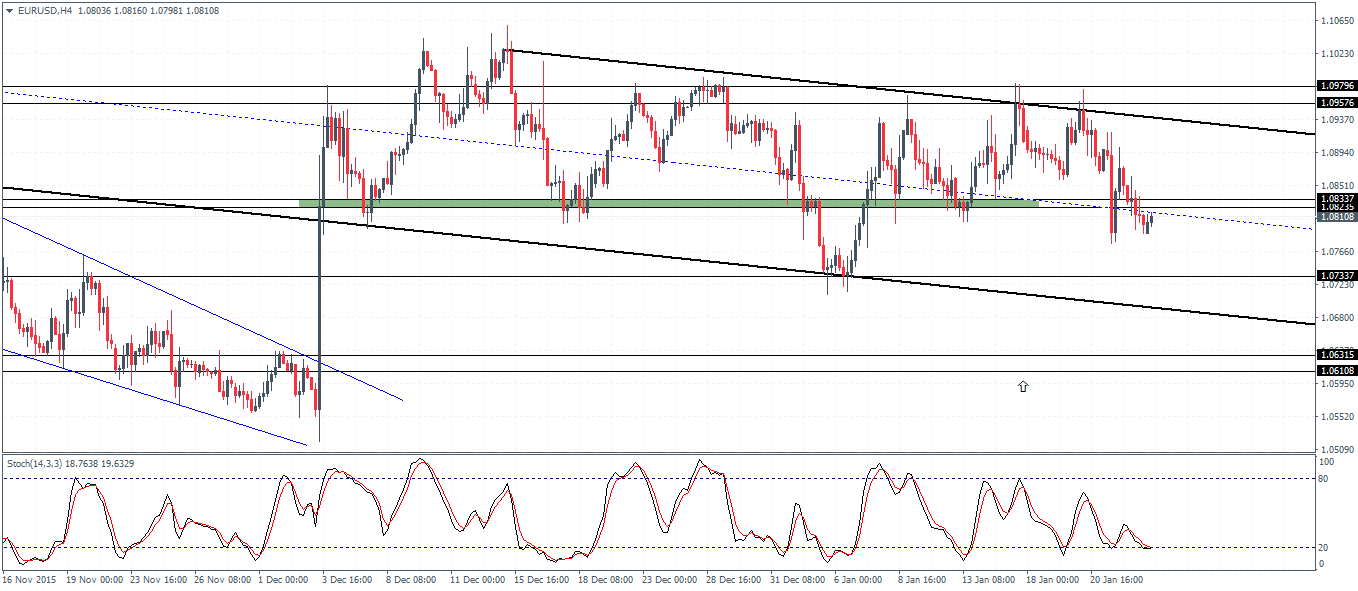
EUR/USD (1.08): EUR/USD remains range bound despite last week's price action. The support at 1.08 remains a key level to watch for following Friday's bearish close. The current retest back to 10833 - 1.08225 could see the support level turn to resistance, which if successful could see a move lower to 1.0737 support. Alternatively, the risk of a break above the support could signal another leg of sideways price action below 1.095 resistance level. The Stochastics on the 4-hour chart signals a move out from the oversold levels marking a short term pullback to the decline.
USD/JPY Daily Analysis

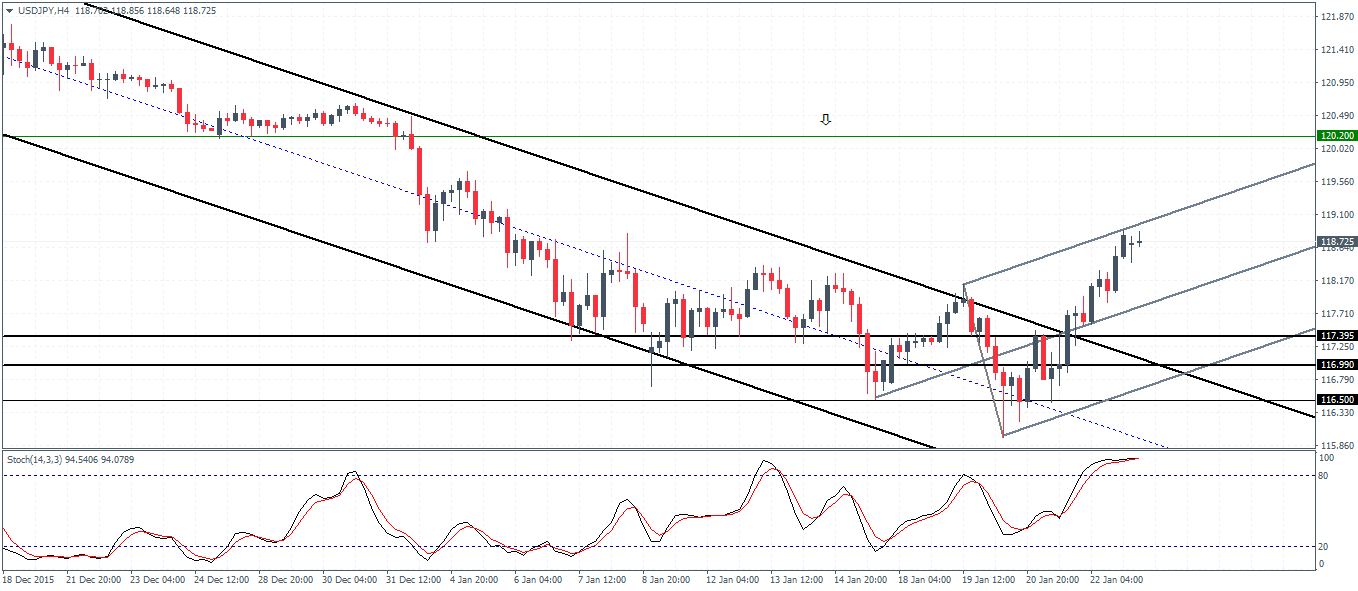
USD/JPY (118.75): USD/JPY eventually closed above 118 resistance and a move back to this level from higher prices is likely in order to establish resistance. The 4-hour chart so far shows a doji candlestick being formed. A break below the doji's low at 118.432 could signal a test back to 117.395 - 116.69 support while to the upside 120.2 remains a key resistance level to watch for. The pullback to the lower support could however mark the correction needed for a strong momentum led rally.
GBP/USD Daily Analysis

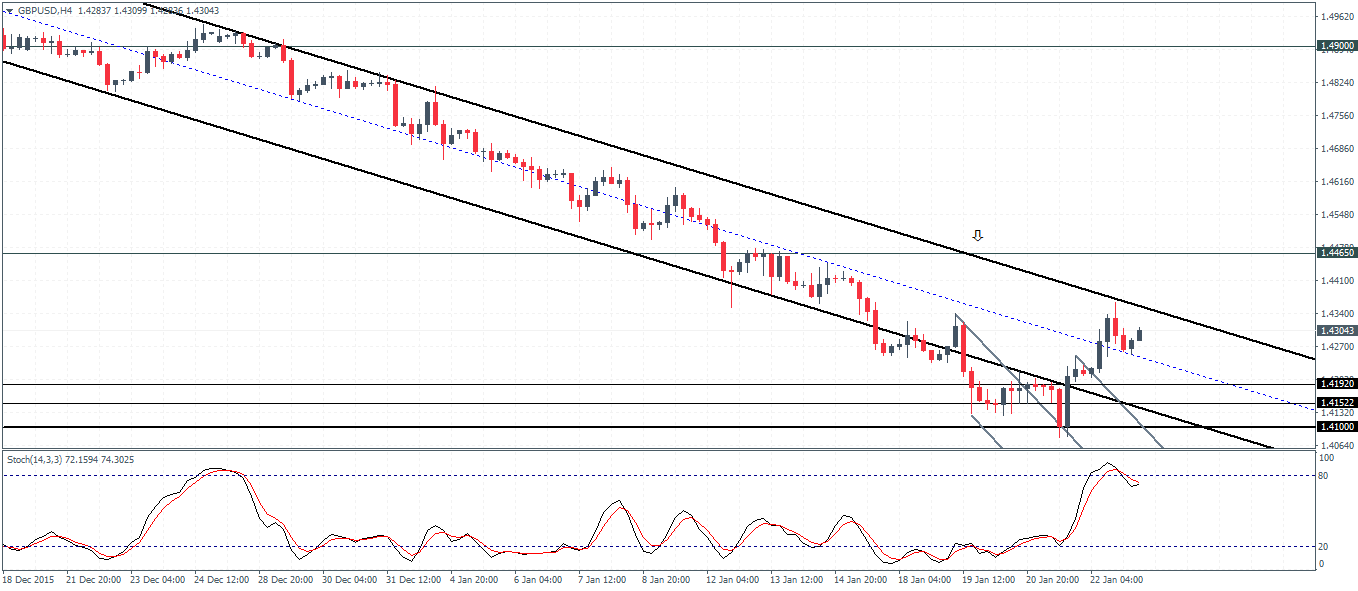
GBP/USD (1.43): GBP/USD is now into the fourth day of making gains. Price action however remains subdued with small bodied candlestick patterns. The 4-hour chart shows a minor support near 1.4192 - 1.4152 being a key level that could be tested on a pullback ahead of a rally towards 1.4465. In the event GBP/USD fails to establish support at 1.4152, there is a risk of prices falling back lower to 1.41 and it could close potentially lower. Above 1.4465, GBP/USD could be looking at a stronger move higher with 1.49 being the next level to watch for.
Gold Daily Analysis

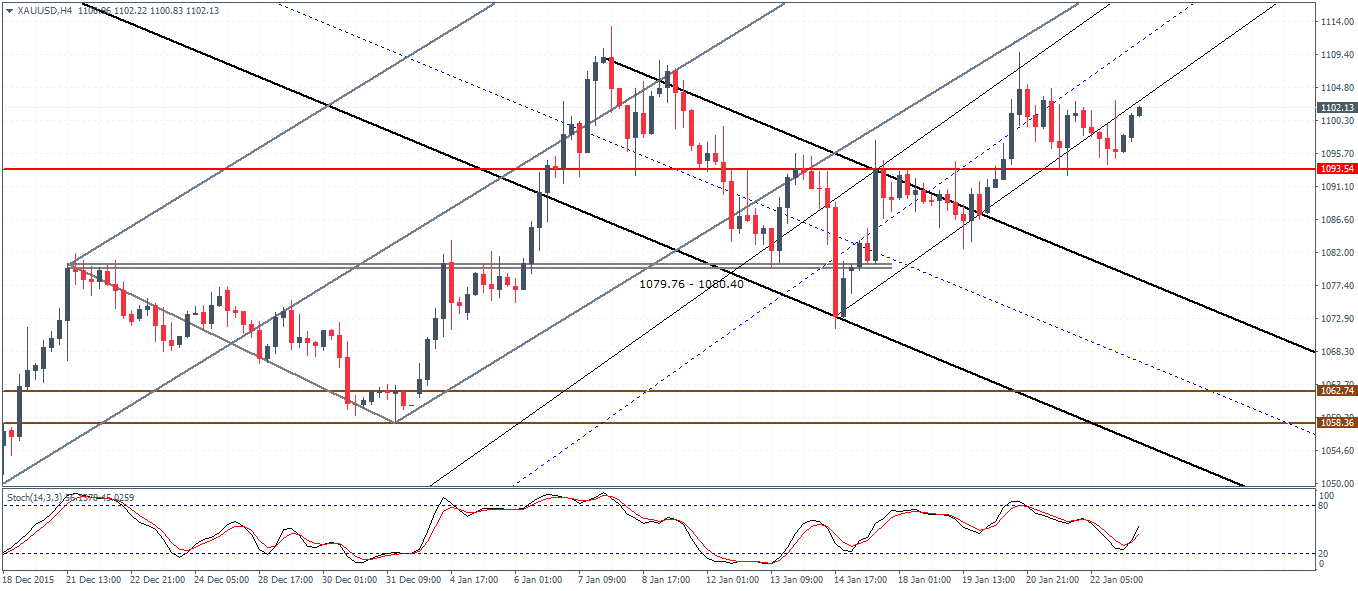
XAU/USD (1102):XAU/USD closed Friday's session with losses and is currently looking to pullback. Prices remain range bound off last Wednesday's range and only a break above or below the high and low could signal further bias. On the 4-hour chart, gold dipped back following a test to 1109 but failed to establish support near 1093. The current move to the upside could therefore see a potential risk of a decline back to 1093 to establish support. As long as prices are trading above 1093, gold is biased to the upside, but a break below 1093 could see a move down to 1080.
