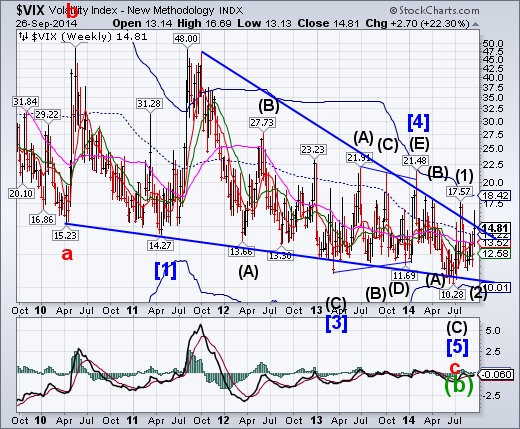
VIX closed above its weekly mid-Cycle resistance at 14.22 after completing what appears to be an irregular Intermediate Wave (2).It is now due to rise above its previous highs to meet or exceed the February 3 top at 21.48. The Friday VIXnado has made another appearance…
S&P 500 has broken its Diagonal trendline.
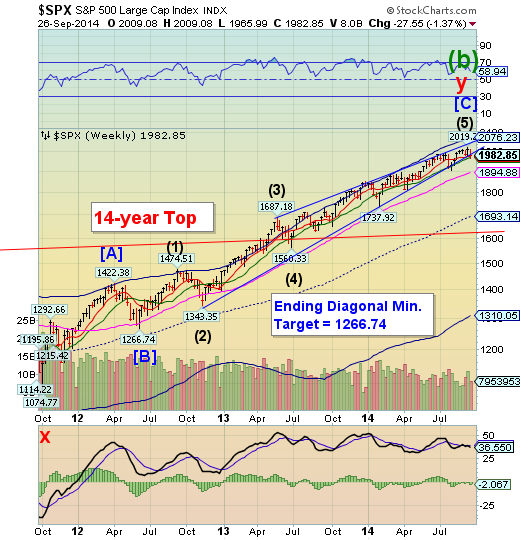
SPX closed beneath the two-year long Ending Diagonal trendline yesterday and remained beneath it today.It also pierced its weekly Intermediate-term support/resistance at 1971.12. That support is now subject to failure and the next support beneath is the weekly Long-term suport at 1894.88. Technical analysis suggests that an Ending Diagonal will be completely retraced, once broken. Elliott Wave analysis suggests that an Intermediate Wave (1) decline will exceed its Intermediate Wave (4) low of the rally in a change of trend.
(ZeroHedge) While we have argued previously that looking at NYSE margin debt in isolation is quite meaningless for two simple reasons: i) in the New Normal hedge funds and algos, not retail and certainly not traders on "lit" venues like the NYSE but instead in dark pools, are the marginal traders, and ii) the relevant trading leverage is obtained from the "shadow banking" and repo markets, not plain vanilla margin debt from exchange clerks, monthly NYSE trading stats do provide some sense of just how levered the individual investor is, and what it may portend for the market should there be a selloff. Which is why we were not surprised to see that based on August data, the trend has continued: while NYSE margin debt rose once again, from $460 billion to $463 billion, just shy of the record set in February when it hit $466 billion and well above the previous bubble peak, it is the investor "Net Worth", or Net Free Credit as some call it: the difference of total free credit + cash balances and margin debt, that for the second consecutive month sank to a fresh record low of ($183) billion.
NDX bounces at Short-term support.
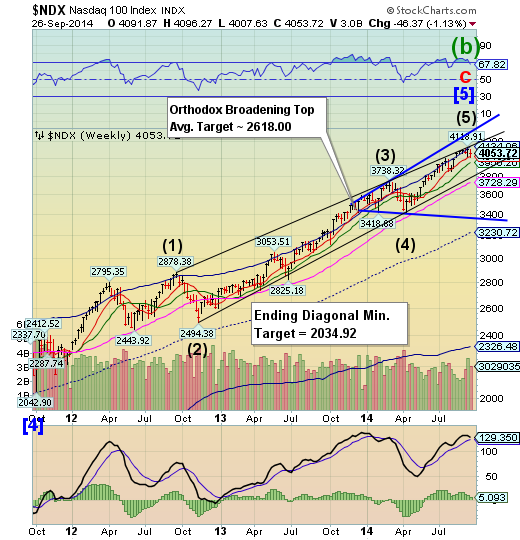
NDX declined to its Short-term support at 4016.87 and bounced again, but not nearly as high as the last week. This has created a neckline and right shoulder to a Head & shoulders formation that implies a break of the Intermediate-term support at 3950.20 in the near future.
(ZeroHedge) With over half of all the stocks in the Russell 2000 and Nasdaq already in a bear market, US equity market indices are becoming increasingly driven by a highly concentrated set of stocks that lack any relationship to macro factors. As BofA shows in the charts below, participation in the record-high exuberance in stocks is waning... and waning fast...
High Yield Flagging.
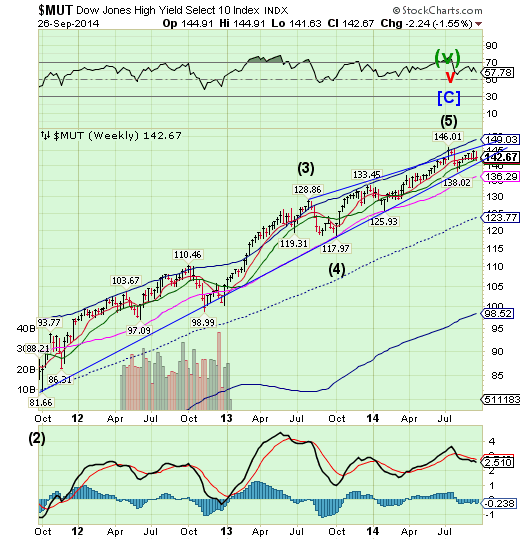
The High Yield Index above Intermediate-term support at 142.10, near its lows for the week. A drop beneath this week’s lows and beneath the Ending diagonal trendline may trigger a cascading decline .
(ZeroHedge) This week's 35bps rise in high-yield credit spreads (or ~10%) is the worst since at least June of last year and anxiety spread through other asset-classes appropriately as cheap-buyback-funding and liquidity concerns weighed on all equities - most aggressively small caps. The Russell 2000 is down around 4% from FOMC (and for the year) even with today's buying-panic this afternoon trying to rescue yesterday's losses.
The Euro Approaches Support.
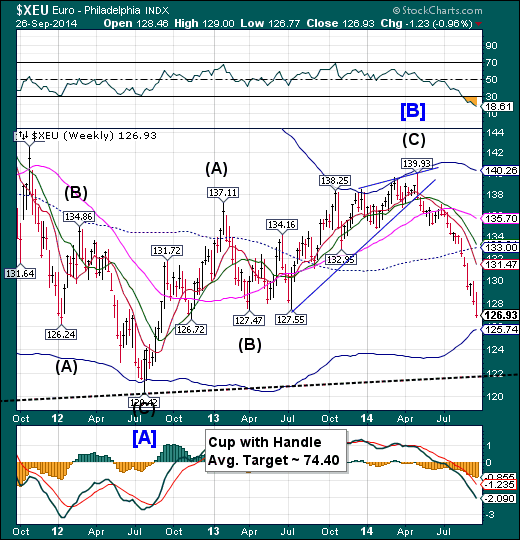
The euro declined through its potential support at 127.55 and appears capable of a bounce at its weekly cycle Bottom at 125.74.It declined through a potential Cycle Pivot on Tuesday, leaving the next possibility next Thursday or Friday, two double Trading Cycle Pivot days. The question is, will it find support at Cycle Bottom at 125.74 or the Lip of a Cup with Handle formation at 122.00?
(Forbes) The euro recently reached its lowest level against the US Dollar since November 2012, it is also set for its worst quarterly performance since late 2011 when the Eurozone crisis was in full swing.
Analysts have long predicted the euro would eventually weaken substantially and yet it held up surprisingly well during the Eurozone crisis – much to the chagrin of many struggling Eurozone countries. But now, with the worst of the crisis debatably behind us, it seems to be plumbing new depths.
Euro Stoxx now threatening its weekly supports.
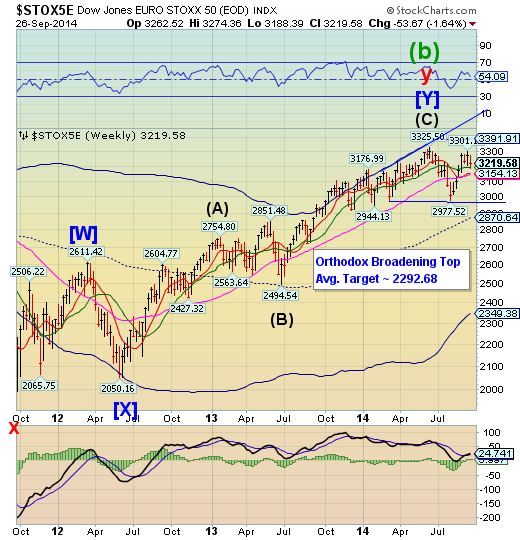
The EuroStoxx 50 Index fell this week, making a marginal new low, but closing above weekly Intermediate-term support at 3191.84. That support has been challenged and its failure may lead to a decline to the weekly Long-term level at 3142.76. Beneath that is the Broadening Top formation, which anticipates a much deeper target, where the Cycle Bottom at 2349.38 may be pierced. In addition, the Cycle Model suggests no potential relief bounce until late October.
(ZeroHedge) Germany's DAX is tumbling this morning (and back in the red for 2014) as The Moscow Times reports Russian courts could get the green light to seize foreign assets on Russian territory under a draft law intended as a response to Western sanctions over the Ukraine crisis. Whether this is retaliation at Italian tax police seizing €30m in assets, including a luxury hotel in Rome and two villas in Sardinia, controlled by Arkady Rotenberg, is unclear, but the timing is highly coincidental and Rotenberg has been a longtime ally of Russian president Vladimir Putin.
The yen meets time and distance targets.
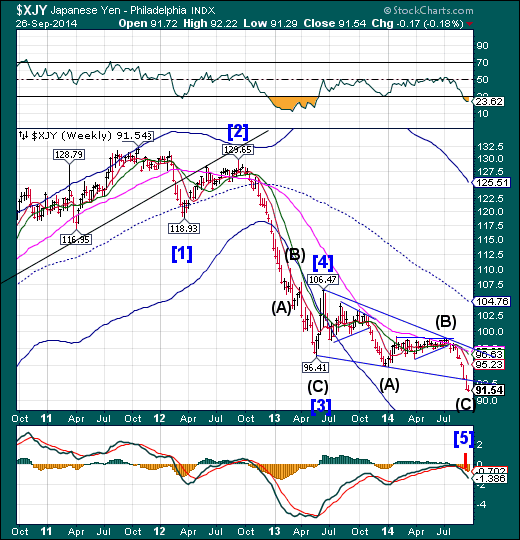
The yen fulfilled the time element for its Master Cycle lowtoday and came within 100 basis points of meeting its downside target of 90.35 also today, which was the last day within a Cycle window to complete its Ending Diagonal. The double Triangles doubly forecast the end of the decline. This will have the effect of drying up the yen carry trade which has been a major source of funding for the equities markets.
(Forbes) It is the end of the Tokyo trading day, Thursday, September 25. The Nikkei 225 has closed up 207 yen (1.28%), lifting the average to 16,374 yen, a high for the year. One reason for the buying: Today is the last day before stocks go ex-dividend.
Another, certainly more important, is the still weakening yen. As I write, the currency is down 67 sen to 109.22-24.
Several analyses in the Nihon Keizai Shimbun place the Bank of Japan in center of these trends and raise questions.
The Nikkei reverses from its multi-decade high.
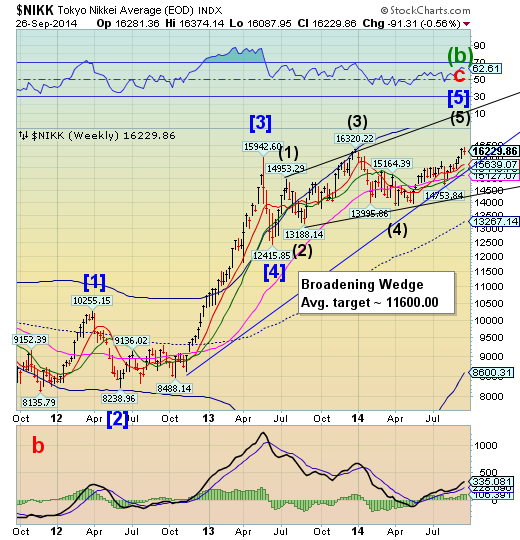
The Nikkei added 10 points to its new multi-decade high on Thursdaybut could not hold its gains through the end of the week.Thursday happened to be designated as a Pivot Turn day by the Cycles Model. Will the reversal in the Yen also bring the reversal in the Nikkei?
(Bloomberg) Prime Minister Shinzo Abe is running out of short-term policy options to extend a rally that sent stocks to a six-year high, said Goldman Sachs Group Inc.
Investors have largely factored in more share-buying by the nation’s $1.2 trillion Government Pension Investment Fund and further fiscal and monetary stimulus to counter the deepest economic contraction in five years, Kathy Matsui, chief Japan strategist at the brokerage, said in an interview in Tokyo on Sept. 19. Goldman Sachs cut Japanese equities to underweight for the next three months on Sept. 5, projecting the Topix index will slide 5.7 percent from yesterday’s close in the period.
US Dollar breaks above a massive technical resistance.
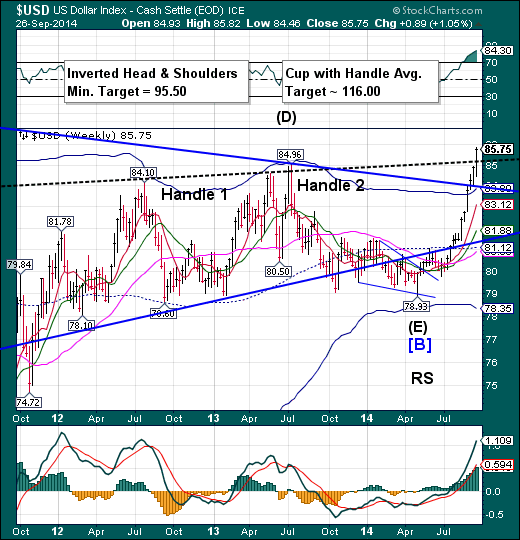
The US Dollar broke above its 2013 high at 84.96 and a major resistance trendline signifying additional gains in value.Last week’s question whether a breakout would occur has been answered. There may yet be a consolidation, but it appears that it will occur at a higher level. The Cycles Model suggests a peak near mid-October.
(Reuters) - Speculators raised their bullish bets on the U.S. dollar in the latest week, as the greenback extended its winning weekly streak against a basket of currencies, according to data from the Commodity Futures Trading Commission released on Friday.
The value of the dollar's net long position rose to $35.81billion in the week ended Sept. 23 from $31.42 billion the previous week.
This was the highest net long level in the greenback inthree weeks when it set a 15-month peak.
USB approaches an important Anniversary.
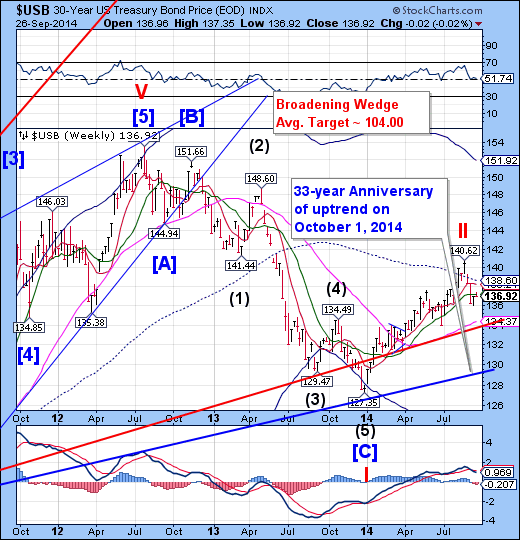
The Long Bond consolidated this week, closing beneath Intermediate-term support at 137.20on Friday. A failure of the retest may send USB to the next support at 134.37 or lower. Chances are now better-than even of an abrupt decline that may last through October in which USB may break its 33-year old trendline.The potential target may be weekly Cycle Bottom support at 125.02. The final Master Cycle low may occur at a much lower level during the week of November 10.
(WSJ) News of Bill Gross's departure from the world's biggest bond fund helped spur selling in a Treasury market already under pressure from upbeat U.S. economic indicators and rising stocks.Other corners of the credit markets also exhibited weakness that some traders attributed—at least partly—to Mr. Gross's exit from Pacific Investment Management Co., underscoring the potential ripple effects of the management change.Many traders and strategists said the drop in Treasury prices was a knee-jerk reaction stemming from the uncertainty over the future investment strategy at Pimco, which Mr. Gross had co-founded.
Gold continues its decline.
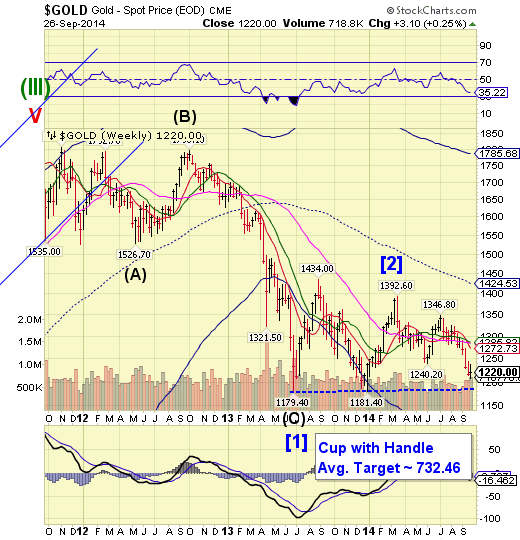
Gold bounced above the Lip of its Cup with Handle formation at 1181.40 but may only be consolidating for a few more days before resuming its decline. The decline may continue through early November.
(Reuters) - The price of gold, down more than a third in three years, is approaching the tipping point where the mining industry would see a spike in the number of producers reducing output or even shutting down operations.Several mines globally have already suspended output in the past 18 months, but not as many as industry watchers expected as producers focused on slashing costs and reworking mine plans to extract more profitable, higher-grade ounces.
But with bullion's slide this week to a nine-month low of $1,208.36 an ounce, those defenses may not be enough.
Crude retests its neckline.
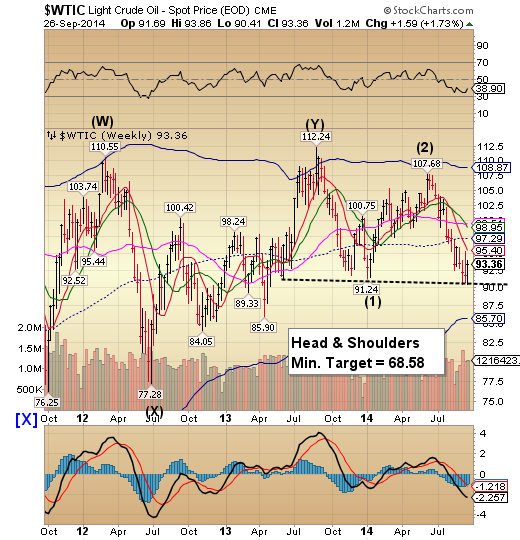
Crude declined to a marginal new low on Monday, then made a 72% retracement of its decline from Short-term resistance.In doing so, it may be forming the right shoulder of a Head & Shoulders formation.If so, the bounce may last for several weeks more as it retraces to mid-cycle resistance at 97.29, also reflecting possible rising global tensions. Once the neckline is crossed, however, the decline may gain momentum.
(FoxBusiness) The price of a gallon of gasoline may soon start with a "2'' across much the country.
Gasoline prices typically decline in autumn, and this year they are being pulled even lower by falling global oil prices. By the end of the year, up to 30 states could have an average gasoline price of less than $3 a gallon.
The average in Springfield, Missouri, is already below $3, according to Tom Kloza, chief oil analyst at the Oil Price Information Service and GasBuddy.com. Several other cities are on the brink.
China challenges its weekly Cycle Top.
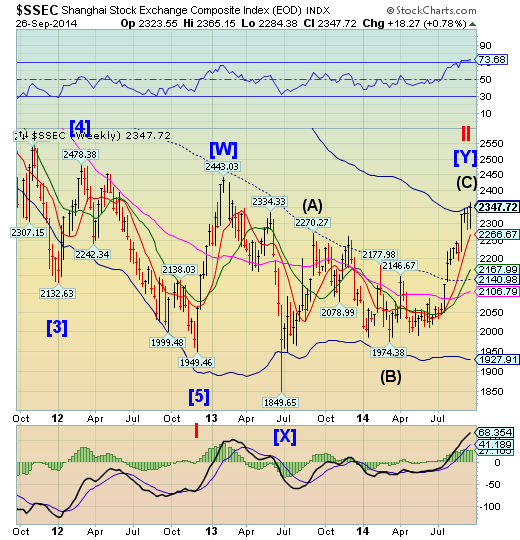
The Shanghai Index extended its Cycle high to Thursday, challenging its Cycle Top at 2354.06,, but closed beneath it.It made a reversal pattern which can be confirmed early next week.The reversal may be even more awe-inspiring than the rally as it declines into mid-to-late October.
(ZeroHedge) As we have reported since May 2013, when we explained the role of Commodity (and particularly copper as well as gold) Funding Deals in Chinese "trade" and especially in the laundering of hot money flows, and most recently when we followed up on the first revelations that unknown amounts of physical commodities had been corzined in China's port of Qingdao, one of the key uses of monetary commodities in China is for purposes of "trade", and especially to artificially boost exports by way of fake trade invoicing. Non-existant exports which, it goes without saying, end up boosting China's already slumping GDP. Well, like a recovering junkie addicted to fabricated data, China finally admitted it has a problem when overnight it "uncovered almost $10 billion in fraudulent trade nationwide as part of an investigation begun in April last year, including many irregularities in the port of Qingdao, the country’s currency regulator said today."
The Banking Index reverses.
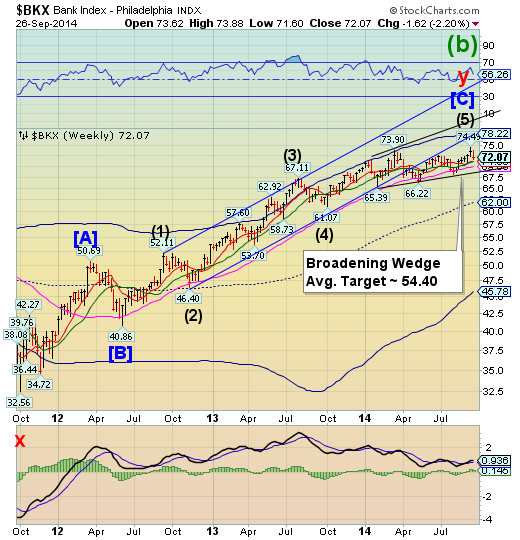
BKX reversed from last week’s Primary Cycle high. No supports are broken, yet. A decline to the Broadening Wedge trendline at 68.00 may bring on a panic decline hat could last through late October.
(ZeroHedge) When is the U.S. banking system going to crash? I can sum it up in three words. Watch the derivatives. It used to be only four, but now there are five "too big to fail" banks in the United States that each have more than 40 trillion dollars in exposure to derivatives. Today, the U.S. national debt is sitting at a grand total of about 17.7 trillion dollars, so when we are talking about 40 trillion dollars we are talking about an amount of money that is almost unimaginable. And unlike stocks and bonds, these derivatives do not represent "investments" in anything. They can be incredibly complex, but essentially they are just paper wagers about what will happen in the future. The truth is that derivatives trading is not too different from betting on baseball or football games. Trading in derivatives is basically just a form of legalized gambling, and the "too big to fail" banks have transformed Wall Street into the largest casino in the history of the planet. When this derivatives bubble bursts (and as surely as I am writing this it will), the pain that it will cause the global economy will be greater than words can describe.
(ZeroHedge) Having totally killed the Japanese government bond market, Shinzo Abe has - unlike the much less transparent Federal Reserve, who allegedly use their proxy Citadel - gone full tilt into buying Japanese stocks (via ETFs). In May, we noted the BoJ's aggressive buying as the Nikkei dropped, and in June we pointed out the BoJ's plan tobuy Nikkei-400 ETFs and so, as Nikkei news reports, it is hardly surprising that the Bank of Japan bought a record JPY 123.6 billion worth of ETFs in August. The market 'knows' that the BoJ tends to buy JPY10-20 billion ETFs when stock prices fall in the morning. The BoJ now holds 1.5% of the entire Japanese equity market cap (or roughly JPY 480 trillion worth) and is set to surpass Nippon Life as the largest individual holder of Japanese stocks. And, since even record BoJ buying was not enough to do the job, Abe has now placed GPIF reform (i.e. legislating that Japan's pension fund buys stocks in much greater size) as a primary goal for his administration. The farce is almost complete as the Japanese ponzi teeters on the brink.
(Reuters) - A group of top U.S. financial regulators urged banks to quickly fix their software to protect it against the "Shellshock" computer bug, saying it could expose them to fraud.
Shellshock is a newly emerged major Internet threat that affects a common software tool found in many operating systems known as Bash, or Bourne-again Shell.
