
"There is nothing new on Wall Street or in stock speculation. What has happened in the past will happen again, and again, and again. This is because human nature does not change, and it is human emotion, solidly build into human nature, that always gets in the way of human intelligence. Of this I am sure.
All through time, people have basically acted the same way in the market as result of greed, fear, ignorance, and hope. This is why the numerical formations and patterns recur on a constant basis.
I absolutely believe that price movement patterns are being repeated. They are recurring patterns that appear over and over, with slight variations. This is because markets are driven by humans - and human nature never changes." - Jesse Livermore
Although we've maintained a predominantly bullish outlook towards both Japan and China (equity markets) over the past year, we've also continuously panned the long-term prospects of US equities, as the Fed pivoted towards further normalizing policy and markets pushed up against what we perceived would be another valuation ceiling (Figure 8). When it came to European markets, we've taken a more agnostic posture, as our higher beta proxy in Spain's IBEX worked across a comparative cyclical ridgeline (Figures 10, 14-15) this year.
All things considered - and despite the Shanghai hitting its latest air pocket last Friday or returning to more earthly ambitions this summer, we still view Japan and China as long-term breakouts and like the relative outperformance prospects of both markets as displayed over the past year.
Coming into August, we noted that a potential equity market breakdown was taking shape in the SPX, that might adversely affect whether the Fed would choose to move off ZIRP in September (see here). And while those suspicions did materialize in the market and within the cautious deliberations and outcome of the September meeting, the considerable elasticity of the subsequent rebound exceeded our own expectations and now closely resembles the Q4 2011 full retracement move.
The question now is, with the December Fed meeting just a few weeks away, could the rally in the US equity markets extend through December, while monetary policy marginally lifts off ZIRP? Our best guesstimate today is they could, if world markets continue to shore-up and actions by the Fed are reassuringly modest.
Back in early fall of 2011, market pressures eased substantially after significant actions were taken by eurozone members and the ECB to quell the growing fires of the sovereign debt crisis, as well as further accommodations made by the Fed to the credit markets through "Operation Twist". In early December of that year, the ECB announced its Long-Term Refinancing Operation (LTRO); A major initiative that largely eliminated the colossal risk that European banks had introduced, after they were essentially locked-out of traditional funding markets.
Although the initial reaction in the markets was less than euphoric, in hindsight, it helped restore confidence and risk appetites heading into 2012. Comparatively speaking, with another much anticipated ECB meeting on deck this Thursday, the current market trades where a retracement decline was extended going into and through the initial LTRO announcement in December 2011 (Figures 2, 6-7).
That said, the SPX remained flat from the end of QE2 in June 2011 until Bernanke strongly suggested, at the June 2012 meeting, that another LSAP program was more than likely before the end of the year. It wasn't until Bernanke outlined in his Jackson Hole speech that QE3 was all but certain in September—then considerably expanded the program with an open-ended commitment in December 2012—that the next leg up in the SPX would commence and trend higher with the Fed's burgeoning balance sheet.
While we'd agree that markets are weighed and appraised with a complicated and non-linear calculus and driven by reflexive forces that elude more fundamental analysis, there is a clear correspondence this cycle between where the equity markets took their largest strides or treaded water and where the Fed was actively buying LSAPs or monitoring conditions between programs.
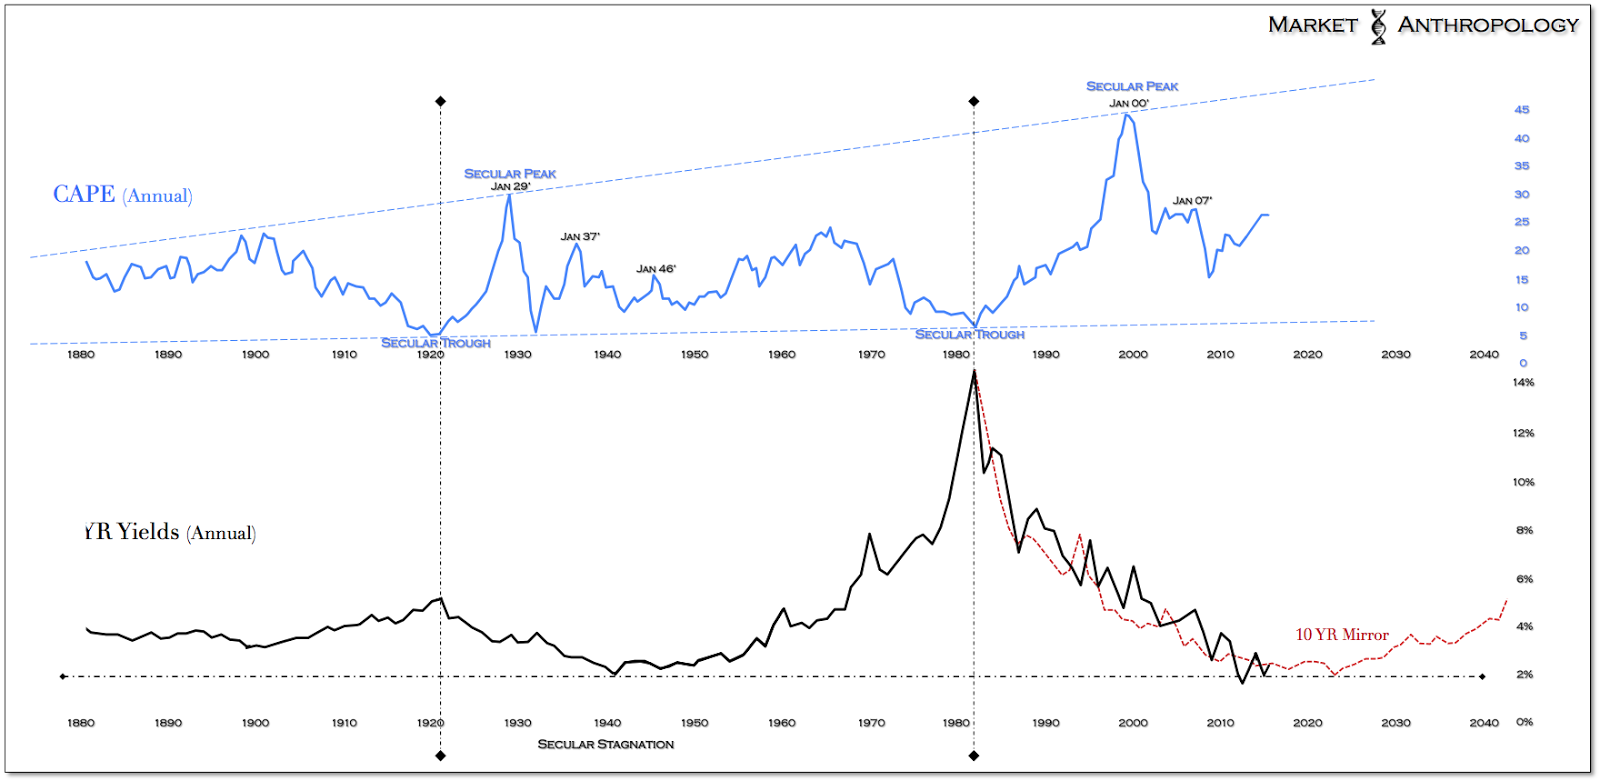
And although market conditions and interventions by the Fed have certainly been extraordinary in their scope and duration, there does exist relevant historical precedence from the last time the Fed intervened in the Treasury markets in the 1940s with LSAPs in even greater proportions (debt/GDP). Likewise, those programs had modest impact on the underlying economy, but greatly supported the financial markets that were both psychologically and structurally mending in the wake of the Great Depression and through the long yield trough between secular growth cycles.
The greater takeaway for us, is that although the SPX may marginally trade higher as it did in Q1 2012, US monetary policy is shifting, which in absence of the extraordinary support extended over the past six years will likely significantly curtail future performance as it did through the back half of the 1940s. As such, we continue to prefer both Japan and China, whose equity markets we believe are in the midst of secular breakouts, despite their respective headwinds that are of daily cause for concern in the financial media.
When it comes to Europe, we take a more pragmatic perspective, as the ECB looks to materially expand QE - perhaps as soon as this week. That said, in light of some of the hardest hit economies, such as Spain, that led the eurozone this year with firming economic growth and falling unemployment, Spain's IBEX has again been a laggard in 2015 and is still following the cyclical ridgeline of the previous major perennial asset unwind in Japan - circa 1997.
The bottom line is, the jury remains out as to whether the ECB can successfully affect a course shift higher here for the asset markets of the peripheral economies hardest hit after the financial and sovereign debt crises. However, if Draghi's initiatives do find traction over the next year, we suspect it should mitigate the downside risk in US equities, while also extending the outperformance of markets such as Japan and China.
- English (UK)
- English (India)
- English (Canada)
- English (Australia)
- English (South Africa)
- English (Philippines)
- English (Nigeria)
- Deutsch
- Español (España)
- Español (México)
- Français
- Italiano
- Nederlands
- Português (Portugal)
- Polski
- Português (Brasil)
- Русский
- Türkçe
- العربية
- Ελληνικά
- Svenska
- Suomi
- עברית
- 日本語
- 한국어
- 简体中文
- 繁體中文
- Bahasa Indonesia
- Bahasa Melayu
- ไทย
- Tiếng Việt
- हिंदी
Will The U.S. Equity Rally Continue If Policy Lifts Off?
Published 11/30/2015, 12:11 AM
Updated 07/09/2023, 06:31 AM
Will The U.S. Equity Rally Continue If Policy Lifts Off?


3rd party Ad. Not an offer or recommendation by Investing.com. See disclosure here or
remove ads
.
Latest comments
Install Our App
Risk Disclosure: Trading in financial instruments and/or cryptocurrencies involves high risks including the risk of losing some, or all, of your investment amount, and may not be suitable for all investors. Prices of cryptocurrencies are extremely volatile and may be affected by external factors such as financial, regulatory or political events. Trading on margin increases the financial risks.
Before deciding to trade in financial instrument or cryptocurrencies you should be fully informed of the risks and costs associated with trading the financial markets, carefully consider your investment objectives, level of experience, and risk appetite, and seek professional advice where needed.
Fusion Media would like to remind you that the data contained in this website is not necessarily real-time nor accurate. The data and prices on the website are not necessarily provided by any market or exchange, but may be provided by market makers, and so prices may not be accurate and may differ from the actual price at any given market, meaning prices are indicative and not appropriate for trading purposes. Fusion Media and any provider of the data contained in this website will not accept liability for any loss or damage as a result of your trading, or your reliance on the information contained within this website.
It is prohibited to use, store, reproduce, display, modify, transmit or distribute the data contained in this website without the explicit prior written permission of Fusion Media and/or the data provider. All intellectual property rights are reserved by the providers and/or the exchange providing the data contained in this website.
Fusion Media may be compensated by the advertisers that appear on the website, based on your interaction with the advertisements or advertisers.
© 2007-2024 - Fusion Media Limited. All Rights Reserved.