Oil prices have seen some volatility recently with all eyes focused on this week’s OPEC meeting. Gold is steady despite uncertainty surrounding the U.S.-China Phase 1 trade talks while agricultural commodities have started the week mixed.

Energy
CRUDE OIL prices tumbled the most in 2-1/2 months last Friday as there seemed to be some discord among OPEC members regarding further production cuts. It’s widely expected that the current level of production cuts will be extended at the meeting, and prices rebounded on Monday after Iraq said that deeper production cuts are on the horizon. Meanwhile, Nigeria has said that it is totally committed to OPEC+ production agreements and confirmed 100% compliance with its own limits in November.Speculative investors remain bullish on the prospects for oil, adding to net long positions in the week to November 26, according to the latest data from CFTC. Net longs are now at the highest since the week of May 21. The number of U.S. oil rigs in production fell for the sixth consecutive week and are now at the lowest since March 2017.
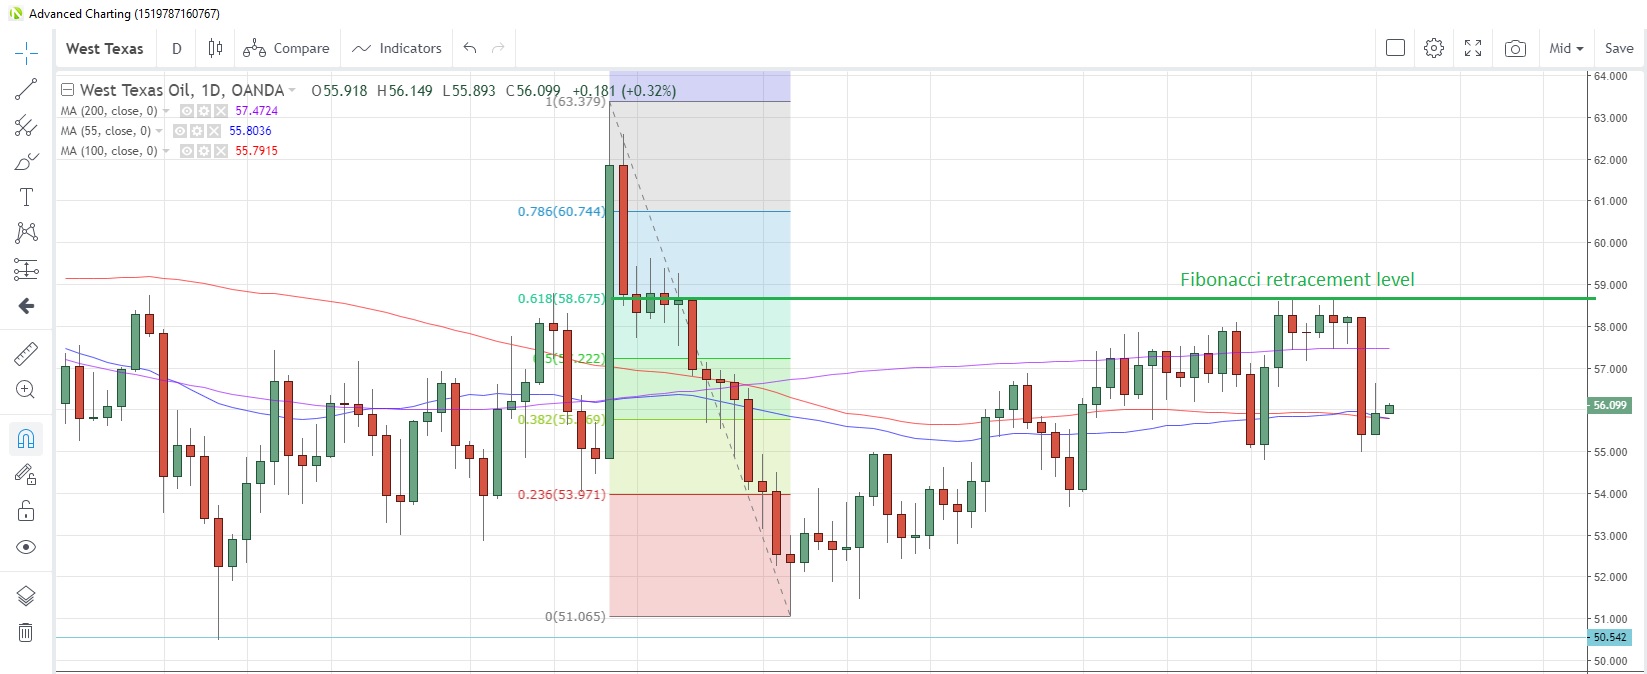
Oil prices have been flitting around the 55- and 100-day moving averages at $55.80 and $55.79 respectively this week. Prices have struggled to overcome Fibonacci resistance at $58.675, which represents the 61.8% retracement of the drop from September 16 to October 3.
NATURAL GAS prices posted the biggest monthly loss since December 2018 last month, snapping a near-term rally that had lasted three months. The bulk of last month’s losses came on Friday, with a drop of 6.7%. Warmer than normal temperatures are forecast across most of the U.S. for the December 7-11 period, which has reduced expectations for future demand.Inventories of natural gas fell by 28 billion cubic feet (bcf) in the week to November 22, the second week in a row of drawdowns from stockpiles. Speculative accounts increased their net short positions for a second week in a row to November 26, CFTC data show.
Precious Metals
GOLD has been steady over the past week, despite the U.S.-China trade negotiations encountering a few headwinds. In addition, U.S. President Trump slapped tariffs on steel and aluminum imports from Brazil and Argentina, which raised concerns about the prospects for China negotiations. China has said it wants all existing tariffs to be rolled back before a Phase 1 deal can be signed, its retaliation for the U.S. passing the HK Democracy Bill last week.
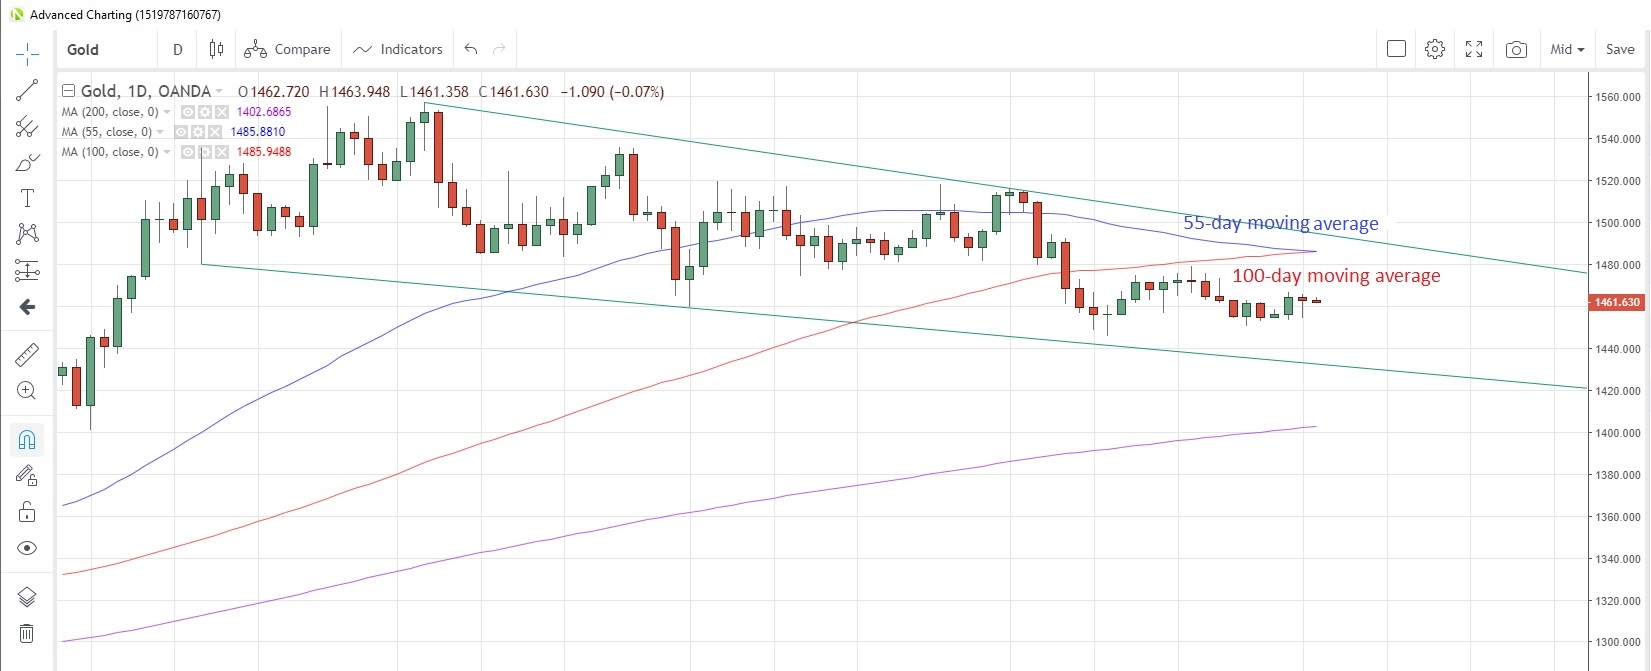
The differing outcomes for the China and U.S. PMIs for October (China outperforming the U.S.) has had little impact on the precious metal. The metal remains in the middle of a downward-sloping channel that has been in place since early-September. The 55-day moving average is below the 100-day moving average at 1,485.96 today for the first time since June 25.

SILVER prices are also little changed on the past week and have been confined to a 16.64-16.98 range for almost a month. Speculative investors were net buyers of silver for the second week running, CFTC data to November 26 show.
The gold/silver (Mint) ratio has been edging higher for the last four sessions, though there is a chance that streak may come to an end today. The 200-day moving average at 86.62 has been acting as near-term resistance since November 19.
PLATINUM has slowly and steadily been climbing for the past three weeks and has started positively this week as it gradually recovers from the big weekly drop seen at the start of last month. There have been few drivers to impact prices recently and it’s mostly sentiment that is determining direction. Speculative investors were net buyers of the commodity for a second straight week to November 26, according to the latest data snapshot from CFTC.
PALLADIUM pushed to another record high yesterday, touching above 1,860 briefly. The precious metal has advanced almost 47% so far this year. Speculative investors pre-empted the last move as they turned net buyers for the first time in four weeks in the week to November 26, according to the latest report from CFTC.
Base metals
COPPER prices fell for the previous three sessions as the outlook for a U.S.-China Phase 1 deal became more uncertain and cloudy. The metal is currently sitting just above the 55-day moving average at 2.6277, which has supported prices for the past 11 days.
Speculative accounts were net sellers of the metal for a third consecutive week to November 26, according to CFTC data. Net short positioning is now at its highest since the week of October 22.
Japan’s copper output in October fell 13.5% from a year earlier to 63,346 tons, according to provisional estimates from an industry association. Last Friday, copper stocks at warehouses monitored by the London Metal Exchange (LME) were at the lowest since March 15. The prospect of revived demand and current low stock levels could be bullish for copper in the longer term.
Agriculturals
SUGAR prices finished last week at the highest level since July 1 as investors contemplated a net supply deficit for the 2019/20 season. Recent surveys suggest that India’s sugar output for the current season may be 27.2 million tons, down 15% from the prior surveys conducted in March. The same surveys suggest Thailand’s sugar production will be down 10%. In addition, last week the International Sugar Organization revised its forecast for the 2019/20 global sugar deficit to 6.1 million tons, a 28% increase from a prior forecast.
Speculative investors have been caught wrong-footed by sugar’s recent rally as they are still net short of the commodity. However, shorts were scaled back for a fifth week to November 26, and they are now at the least since the week of July 16.
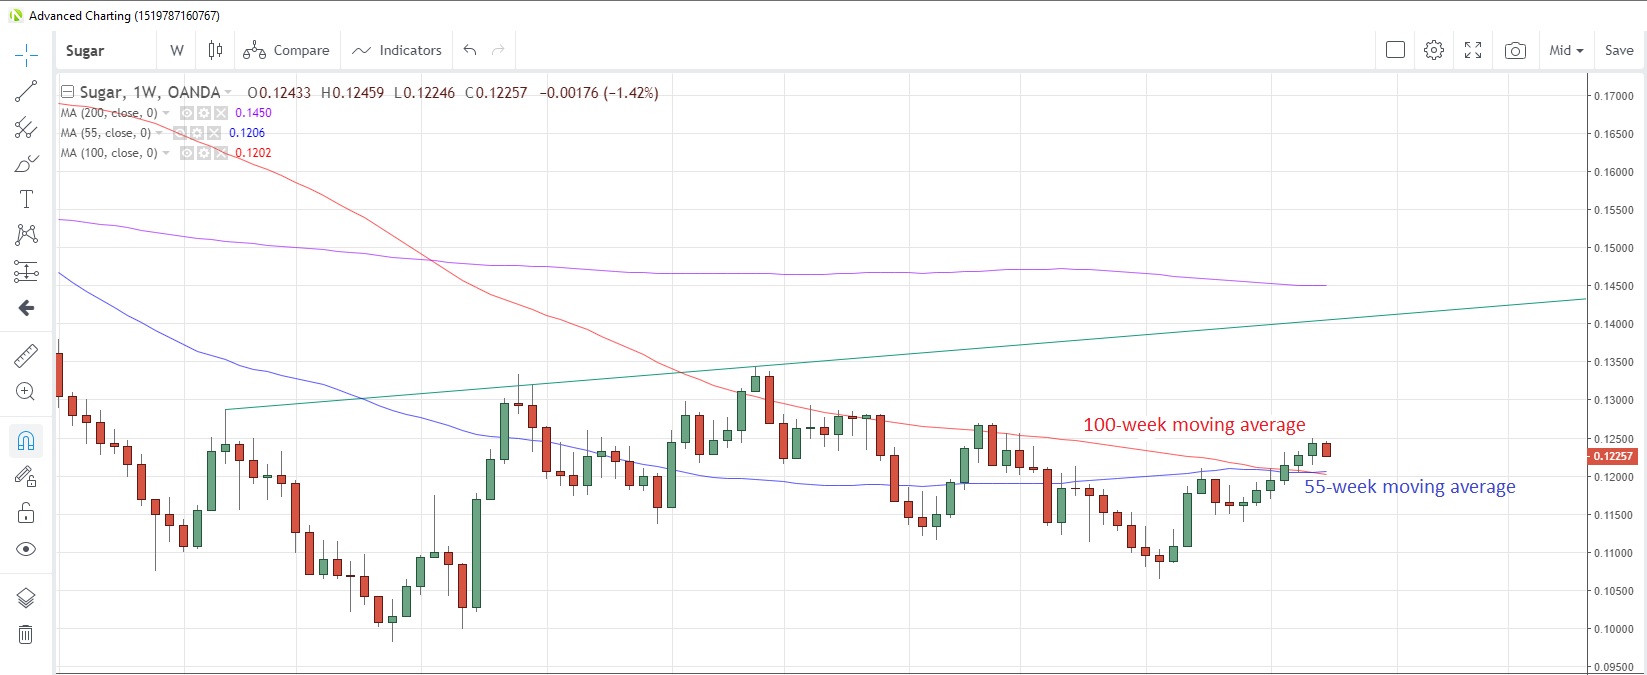
There has been a mild retracement in sugar of 1.4% so far this week which, if it continues, could bring a six-week rally to an end. However, prices may find support at the convergence of the 55- and 100-week moving averages at 0.1206 and 0.1202 respectively.

SOYBEANS prices could be poised for the first positive session in nine days today if they can hold on to gains made so far. Prices touched a near-three month low yesterday as investors considered the dimmed prospects for a Phase 1 trade deal. Speculative investors were net sellers for a fourth consecutive week, reducing net long positioning to the lowest since September 24.
CORN started a rebound from a 10-week low last Friday and appears to be extending the advance to today. Corn faces the 55-day moving average above at 3.7525 and the 100-day moving average at 3.7821. Speculative investors remain bearish on the commodity, with net shorts now at the highest since the week of September 24.
WHEAT posted the biggest weekly gain since mid-June last week as news broke that Argentina’s wheat crop had been decimated by adverse weather. Speculative investors had already increased net long position for a third week to November 26, the data from CFTC show.
