We close out the month of April, and it’s a pretty soggy picture, although, given the data flow risk aversion could be higher. Certainly, from an economics perspective, the data flow through Asia has reinforced the issue that if you want growth, you head Stateside, and even then, Q2 GDP is likely to slow to 2% to 2.5%. What we have seen today won’t inspire though, with China’s manufacturing PMI falling to 50.1, relative to consensus of 50.6, with a big miss on services PMI (54.3 vs 54.9 eyed). Shortly after the NBS print, we saw the Caixin manufacturing print, which looks at manufacturing activity from small- and medium-end of town, printing 50.2 and a decent miss to the consnesus of 50.9.
Elsewhere in Asia, Korea’s March industrial production fell 2.8% YoY, while we wait for Taiwan’s Q1 GDP print (due at 18:00 aest), and this is expected to be seen at 1.4% - the lowest since mid-2016. Of course, this carries on from the poor export numbers seen recently in Korea, Taiwan and Singapore…. The bulls were hoping that China could again be the shining light of the region, but that hasn’t come to fruition.
Australia private sector credit expanded 0.3% in March, as was expected, and that won’t give the RBA any new insights, and we can look across the Aussie interest rates curve and see little change on the day, with the 3-year Aussie govt bond unchanged at 1.29%. We saw a dip in AUDUSD into 0.7034 on the China data, following the buying seen in USDCNH, although we are seeing a few buyers take AUDUSD a touch higher – let's see how European and US traders act, but this is one where you take the timeframe down into hourly charts or below.
The ASX 200 is closing out April with a monthly gain of 2.3% at this stage, although the set-up on the daily has a distinctively heavy feel and is gravitating towards trend support at 6300.
Sellers have made light work of pushing the Aussie index lower, with volumes 10% below the 30-day average – thus, it feels like the bid is not there and the index is simply falling under its own weight. Breadth has been quite poor, with 70% of stocks lower on the day, with the materials sector leading the decline and is 1.3% move lower on the day, subtracting 15.3-points from the index. Consider the materials space was falling into the China PMI data, and actually, iron ore futures are now 1.8% higher on the day, while Chinese equity indices are now positive - so it’s hard to say moves in mining names are a reflection of economic sentiment.
Energy is also finding sellers easy to come by, with the sector -1.3%, with REITs and utilities, also lower by over 1% and while month-end flows could be behind this, I would be eyeing the US 2s10s yield curve (see below) and questioning if this break higher could be seeing some capital flow out of the equity bond proxies.

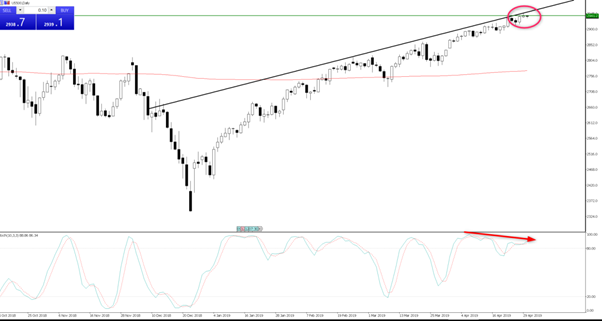
Turning to the session ahead, I continue to watch the S&P 500 given it has finally broken to new highs on an intra-day basis, and there is still little conviction to being short the market here. That said, while we have taken out the September 2018 high (the green line), we are pushing the November trend resistance, and there is clear divergence with stochastic momentum. The tide may be turning, but price will reveal all, and should it roll over we should see higher implied volatility and a better bid in the JPY – sell the break in SEKJPY is the trade I will be eyeing here.

It feels like we may see traders looking at reducing some exposures to the S&P 500 a touch given the event risk this week, and looking to part hedge, as vols are low and hedging is still cheap here and as we can see the S&P 500 (inverted - yellow line) is diverging from the high yield/US treasury spread, which is a red flag.

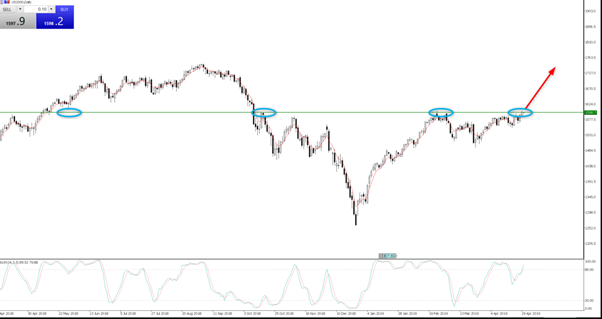
My preference though is to take a look at the Russell 2000 (US2000) and reload on a closing break of 1598/1600, and I will wait for the market to push me into the trade. This set-up looks powerful, and a break of this resistance will attract new capital here.

The DAX (GER30) has been a great buy, and for those still in the trade my own view is to hold until price closes below the 5-day EMA, which it has held since 12 April. We saw indecision in the price action yesterday, but as long as the bulls support into the short-term average then it's onwards and upwards.
US data in upcoming trade is mostly tier two releases, centring on the employment cost index (ECI), Chicago PMI, pending home sales and consumer confidence, although I can’t see these data points moving markets too greatly. We have seen some better selling in the US 10yr treasury of late (now 2.52%), although yesterday’s US core PCE printed 1.553% (well 1.6% rounded) has kept a lid on selling and it feels as though if equities are to push higher then bond yields are key here and need to remain anchored. We’ve certainly heard a decent amount of narrative of late from some key Fed officials on the triggers to cut the fed funds rate, and we’ll hear more about this on Thursday morning (4 am aest) when we see the April FOMC statement and then governor Powell’s press conference shortly after. All eyes fall on how closely aligned Powell is to Charles Evans view that rate cuts could play out if core inflation falls below 1.5% on a sustained basis.
The USD index is sitting on key support here, and talk that funds are rebalancing portfolio at month-end may have credence given the greenback has performed formidably through April. This chart remains central, and now we have the backtest, a rejection here could be quite powerful for USD bulls.
