
Talking Points:- Copper traced Shanghai shares, supported by stimulus expectation
- Gold bounced though under pressure by US rate rise speculations
- Oil recovered with risk-on sentiment, bearish fundamentals lingered
Chinese authorities had a unanimous message for the market: stability is a-coming. PBoC governor said at last week G20 meeting that “correction in the stock market is almost done” and China’s financial markets are expected to become more stable. Stock regulator CSRC posted on Weibo blog that the state margin lender will continue to support market stability, and risks associated with high levels of leverage have eased.
Hence market sentiment shifted from a slight risk-off following mixed (and rather disappointing) US employment data on Friday, to risk-on after Shanghai Composite index led Nikkei, Hang Seng, AUD and commodities on a moderate recovery.
Copper closely traced Shanghai stock index, now that China market has returned from a long weekend. Investors in the metal seemed to find a reprieve to have a leading indicator to guide price action. Copper shrugged off Friday’s weakness due to lower than forecasted German factory orders in July, and will be an apparent beneficiary of presumably steady Chinese financial market or further stimulus actions.
Gold rose slightly following gains in commodities and Chinese stocks early in the Asian session, although it was still weighed down by US rate rise speculations. Likewise, safe-haven currency JPY posted conflicting moves, lowering before China open and rising afterwards, perhaps fueled by gains in Nikkei.
Gold dipped near two-week low on Friday as a seven-year low US unemployment rate at 5.1 percent sustained provisions for rate rise, despite a low August NFP.
Oil swung around in tandem with Chinese stocks and pared its early gains as Shanghai index fell to 3150s region below its opening level. Once the excitement post-NFP and China re-opening wears off, oil investors will return to (over)supply fundamentals and whether prices already hit rock bottom. A positive response to the latter was seen in U.S. Commodity Futures Trading Commission data for the week ending September 1st, as hedge funds liquidated the most bearish WTI bets since May.
Looking ahead, Venezuela reportedly asked OPEC for a summit to address the global glut, where producers outside the group will also be invited. A nearly complete Iran deal looms large as Obama secured enough votes to veto any disapproval resolution by U.S. Congress and only three votes shy of the 41 needed to filibuster a disapproval.
GOLD TECHNICAL ANALYSIS
Gold paused on its descent today after three sessions of losses. A firm support level is seen at the 23.6% Fibo at 1109.3, that has previously provided technical guidance as a resistance level. Gold prices may find a temporary relief with downward momentum near exhaustion, hence the bears had better wait for a clean break of support before entering positions.

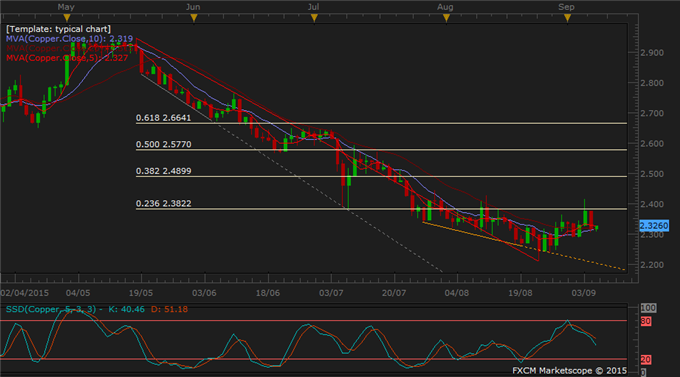
COPPER TECHNICAL ANALYSIS
A clean break above 20-day moving average hinted that the recent downtrend in copper has finished. The metal continued on a correction period with persistent downward momentum. The bulls should wait until prices test or break above the 23.6% Fibo for better hints of an upside development. Range trading is ripe at current levels as copper swings between 2.2980-2.3820.
CRUDE OIL TECHNICAL ANALYSIS
Oil consistently retained above 20-day moving average in a sideways fashion with little directional signal. Momentum signals point to further downside, hence the bulls and bears alike may watch out for a break or rebound from the MA to gauge any upcoming bias. It is unclear whether oil will follow through on this momentum all the way to August’s record low.
