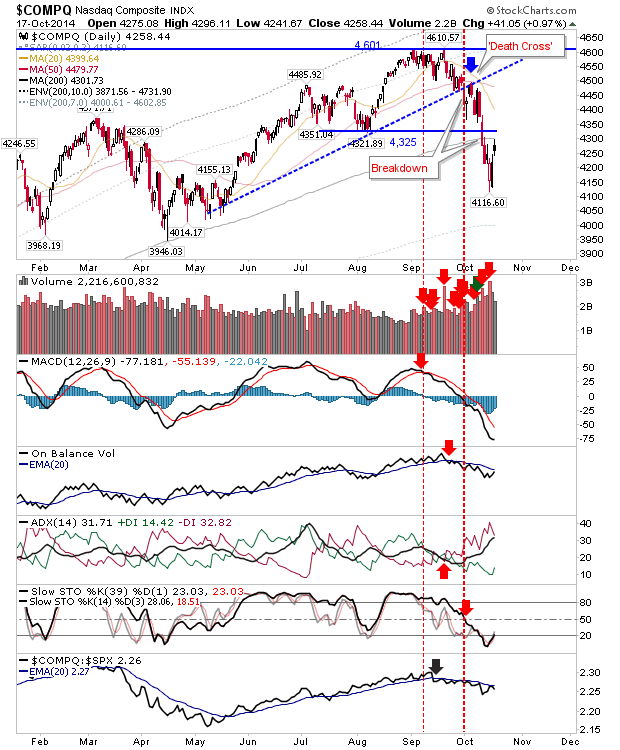
Friday's gains helped put some distance on Wednesday's spike reversals. This will offer bulls something to defend when selling inevitable returns. Friday's action didn't all go bulls' way as key moving averages played a role in halting the advance for a couple of indices.
In the case of the NASDAQ, the blocker was the 200-day MA. Friday's high tagged the 200-day MA before weakening - although there was a bit of a recovery into the close. The index is no longer oversold, giving bears an opportunity to turn the screw again. However, a close above the 200-day MA would give bulls confidence that last week was a low of note.
One thing which may help bulls is the Semiconductor Index. After the killer gap down, the index is well placed to post a bullish 'island reversal'; all that's required is a gap higher Monday (which doesn't close in subsequent trading). The index is also edging out of oversold conditions, not a bad place to be bringing buyers in. Should an 'island reversal' develop, it will help both the Nasdaq and NASDAQ 100.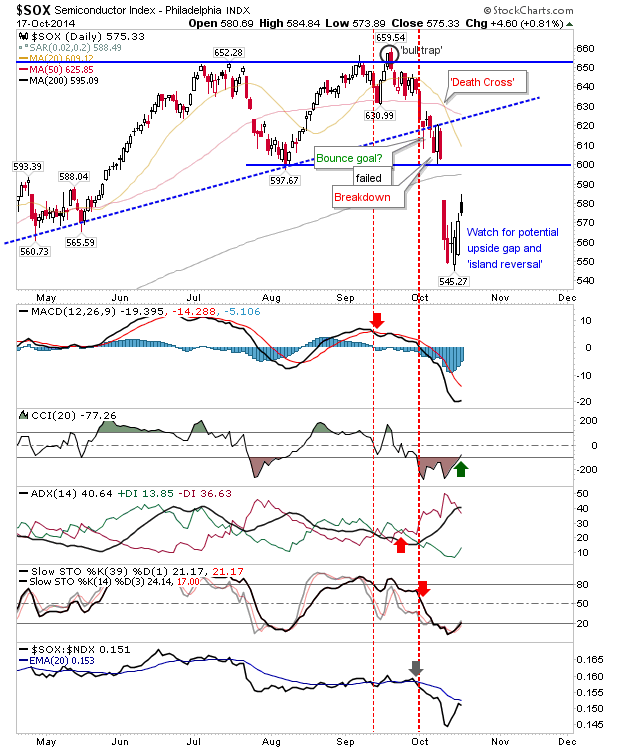
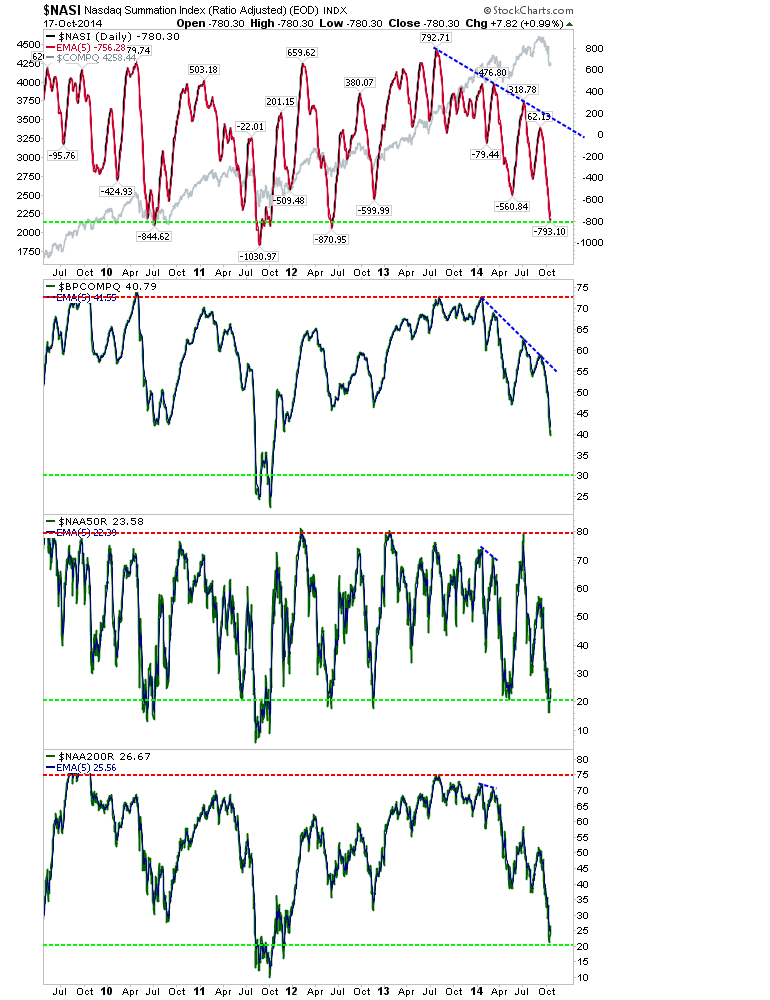
NASDAQ breadth is at a stage which has marked swing lows in the past - although it hasn't reached the depths of the 2011 sell off.
There is one area bulls need to be wary of, and that's the breakdown of the NASDAQ from the channel on the weekly time frame. Volume was also significantly higher on the break. Often enough, the net result of this is a new, slower trend, but this could also morph into sloppy sideways action - which does nobody any favors.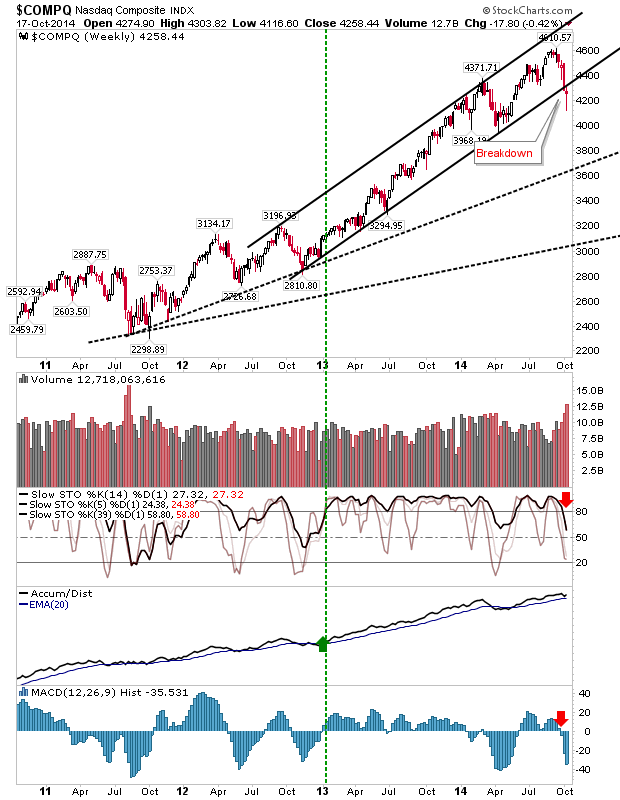
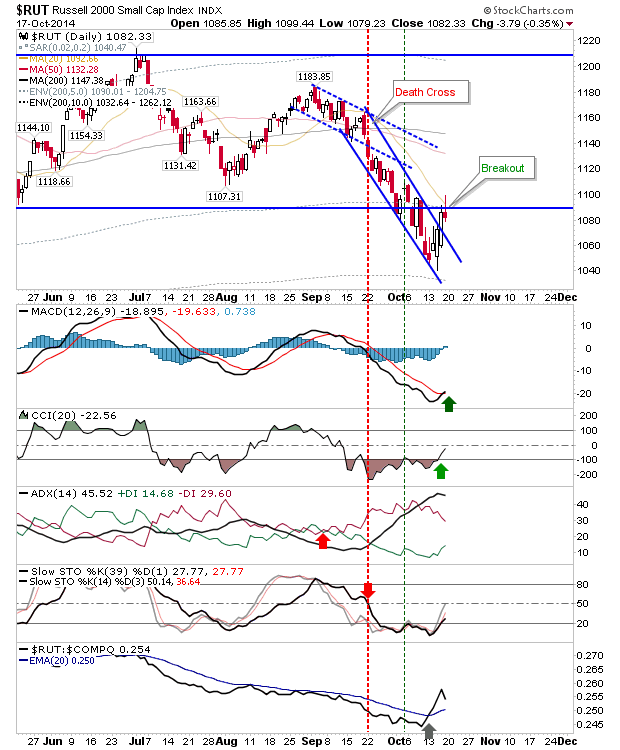
The other index to run into moving average resistance was the Russell 2000. It reversed off the 20-day MA, a moving average often attacked by shorts. Look for near term selling pressure, although shorts moving here would probably cover close to 1,050.
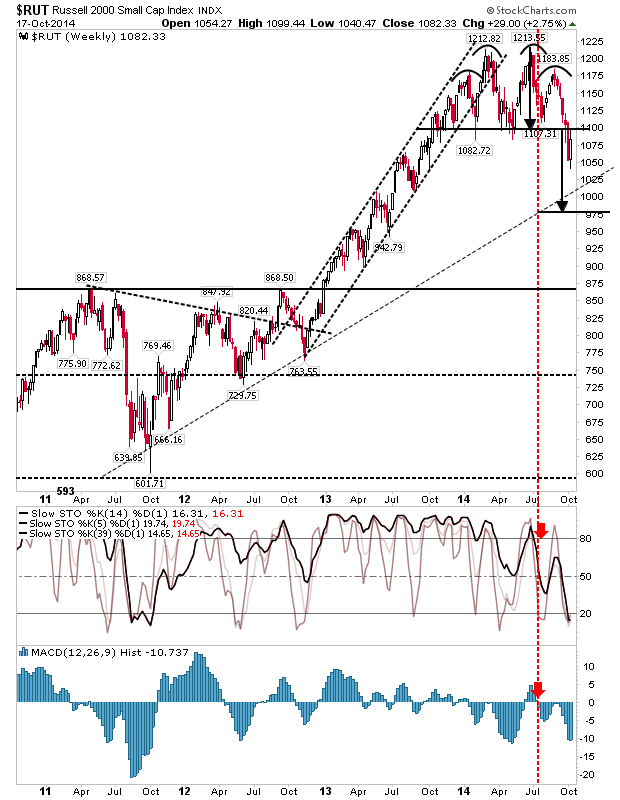
The Russell 2000 weekly picture shows a rebound which tagged the neckline of the head-and-shoulder reversal. More gutsy shorts may look for the measured move down to 975 - particularly if 1,050 doesn't act as an area for support.
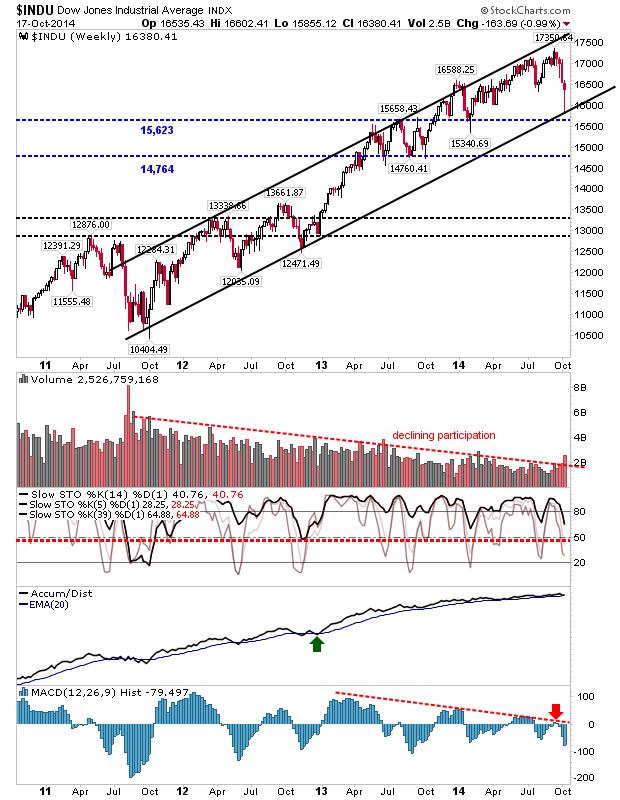
Of Large Cap indices, the Dow is the most interesting. It bounced off weekly channel support. Watch for a secondary tag of this channel line should sellers return this week. The big negative is declining participation and a very weak MACD. If stochastics undercut the hashed red-line it will likely mark a more sustained bearish phase for this index.
For this week, look for a 'walk-down' retest of last week's lows. Bulls will want to see light volume on this retest. If bulls are to maintain last week's buying, then look for a gap 'island reversal' in the Semiconductor index, this should offer the ground work for further short term gains.
