In 2015 there was a great deal of “fear and loathing” related to the bond market. With speculation rampant that the Fed would “finally” raise interest rates, there seemed to be a growing sense of inevitability that the 30-year bull market in bonds was about to end.
And perhaps it will. But as it turns out, it looks like bonds may not go down without a fight.
(See also This is What a Classic Bottom Formation Looks Like)
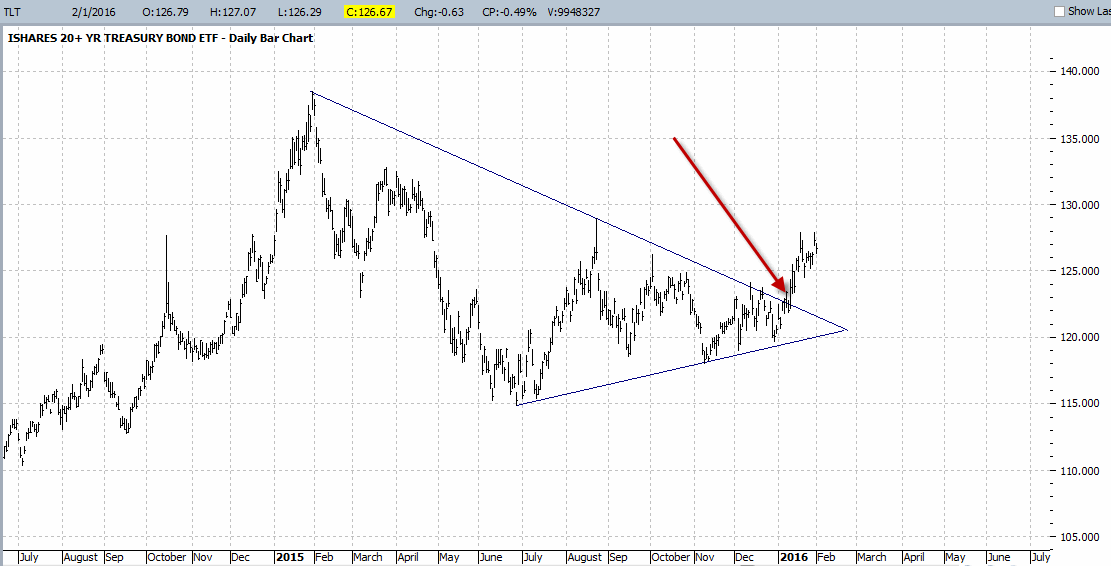
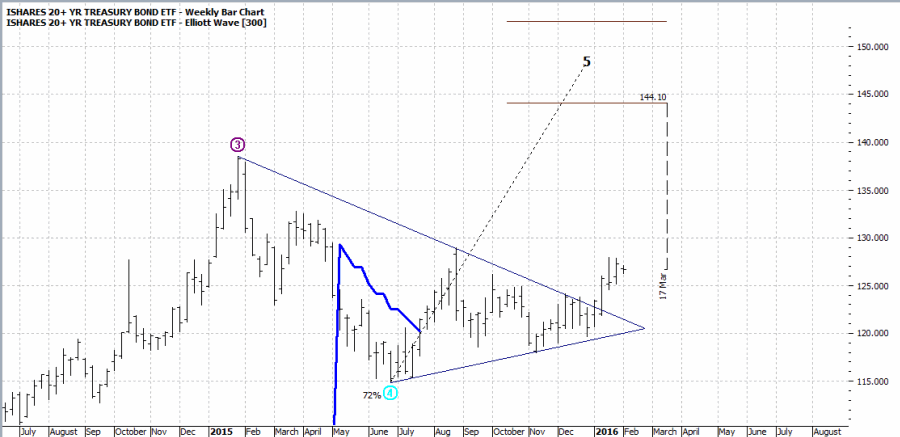
In Figures 1 and 2 you see updated versions of two charts I included in this article.
Figure 1 (Courtesy ProfitSource by HUBB)
Figure 2 (Courtesy ProfitSource by HUBB)
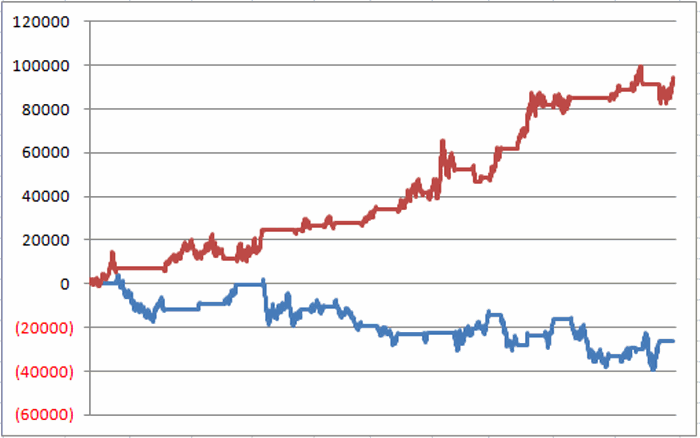
Likewise in this article I discussed the fact that the U.S. treasury bond market typically trades inversely to the Japanese stock market. Figure 3 displays the performance of t-bond futures (a 1-point move in t-bond futures = $1,000) since 12/31/97 when ticker (N:EWJ) (an ETF that tracks the Japanese stock market) is:
*In a downtrend (i.e., the 5-week moving average is below the 30-week moving average), which is bullish for t-bonds (red line)
*In an uptrend (i.e., the 5-week moving average is above the 30-week moving average), which is bearish for t-bonds (blue line)
Figure 3 T-bond performance when EWJ indicator is bullish for bonds (red line) versus bearish for bonds (blue line) 12/31/1997-Present
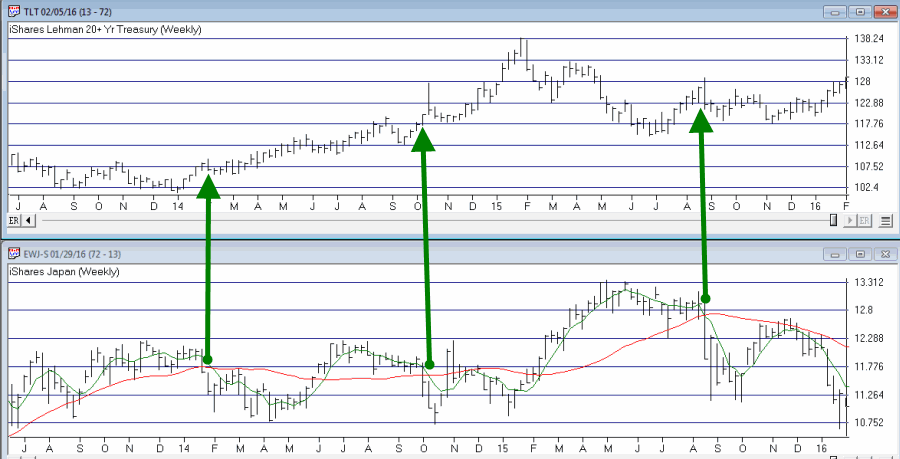
Although the bull and bear track record is far from perfect, the point is that there is clearly a difference in performance between the two. As you can see in Figure 4, EWJ remains in a firm downtrend (note at far right of bottom clip that 5-week MA is well below 30-week MA), which i.e., is theoretically bullish for bonds.
Figure 4
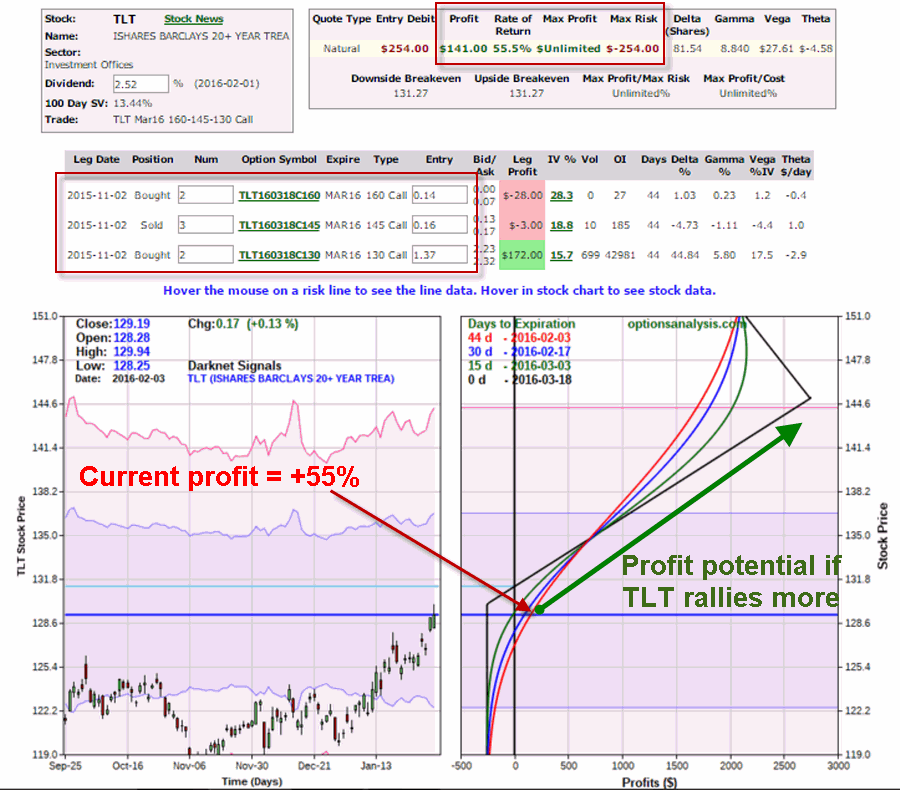
Will bonds continue to rally? It beats me. Still the “Risk a few bucks on the chance that bonds surprise the heck out of everyone and rally like crazy” trade that is now showing a profit of 55% and is poised for huge gains if by chance this rally somehow continues.
Figure 5 (Courtesy www.OptionsAnalysis.com)
Which is entirely the point of the “Risk a few bucks on the chance that [chosen market/stock/ETF/index here] surprise the heck out of everyone and rally like crazy” trade.
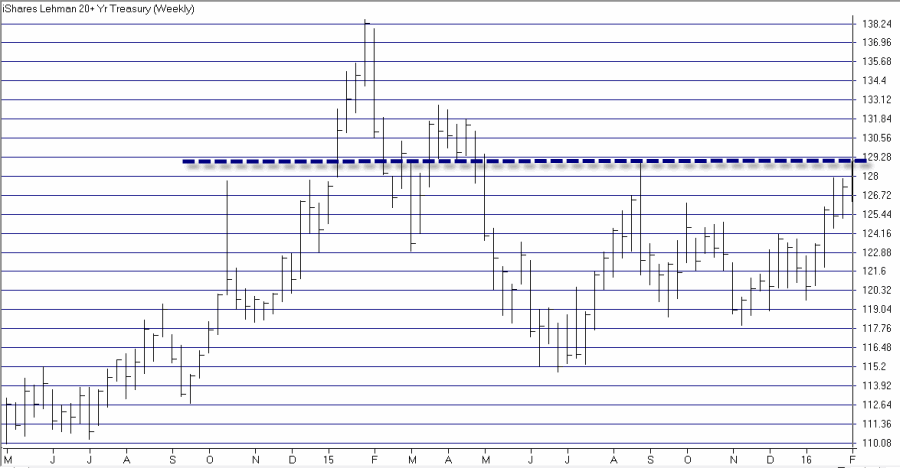
One caveat: As is always the case in the markets, you can see whatever you wan to see in any situation. While most of what I have showed so far is “bullish” for bonds, still (N:TLT) is a bit “overextended” at the moment and is in a key resistance range as you can see in Figure 6.
Figure 6 (Courtesy AIQ TradingExpert)
Summary
I am not telling you to be bullish on t-bonds. Nor am I telling you that the recent rally in bonds is about to peter out.
I am telling you that when “Everybody Knows” that bonds [or whatever] can’t possibly advance in the face of the Fed raising rates [or whatever]……there is a good chance that “Everybody Knows Nothing.”

