Last week I published an article titled This is What a Classic Top Formation Looks Like, which highlighted some recent action in the sugar futures market that served as a classic example of a top formation, complete with test, retests, thrusts, false breakouts and of course the inevitable breakdown.
Which all proves once again that finding top formations in hindsight is pretty darned easy.
Figuring things out in real-time is typically a little tougher. For when even the most classic top or bottom appears to be forming perfectly, there always remains the chance that “things won’t work out as planned this time around.” So with that caveat firmly in mind let’s direct our attention to the May soybeans futures contract (BTW: if you have not the slightest interest in soybeans please not that the example is meant to serve as, well, an example of a classic potential bottom formation and not necessarily as a recommendation to trade soybean futures).
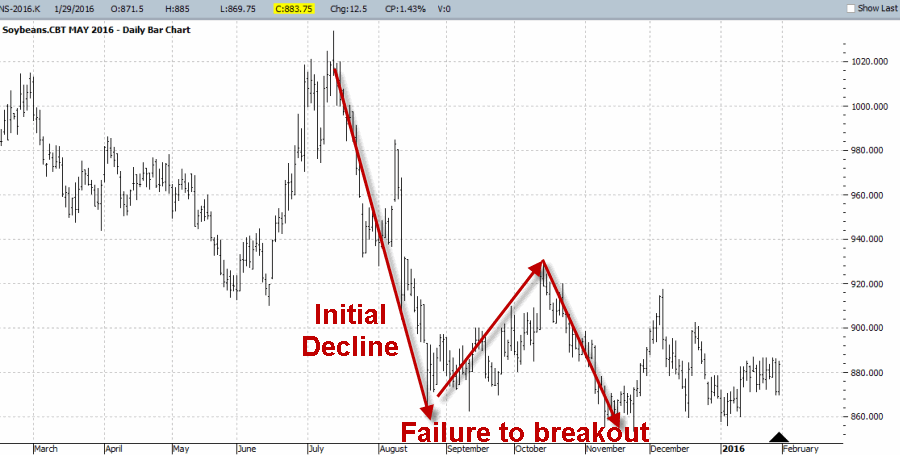
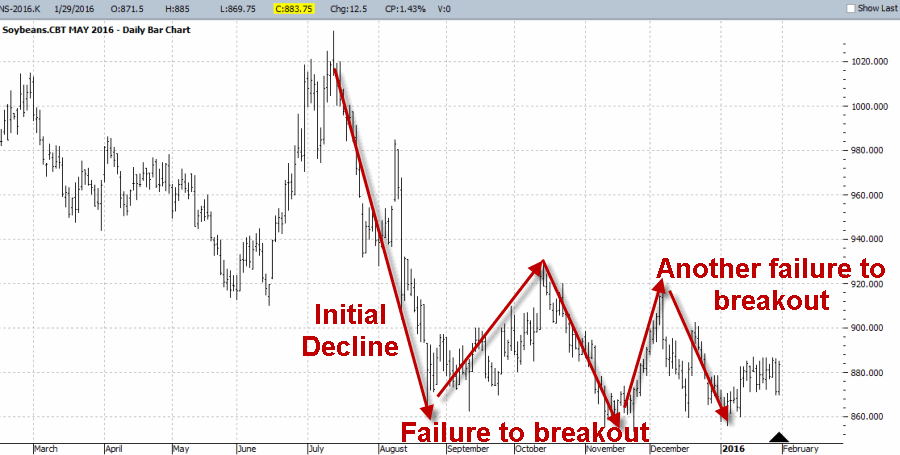
To get the gist of the idea please peruse Figures 1 through 4 below.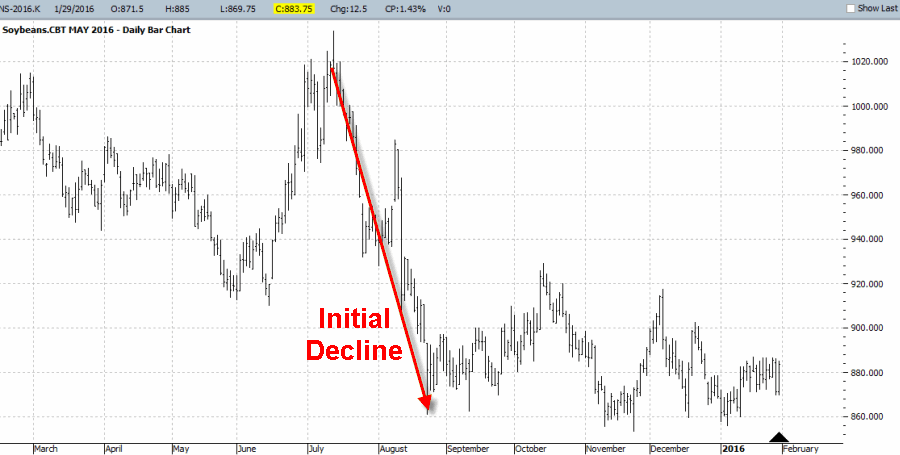
(Courtesy: ProfitSource by HUBB)
(Courtesy: ProfitSource by HUBB)
(Courtesy: ProfitSource by HUBB)
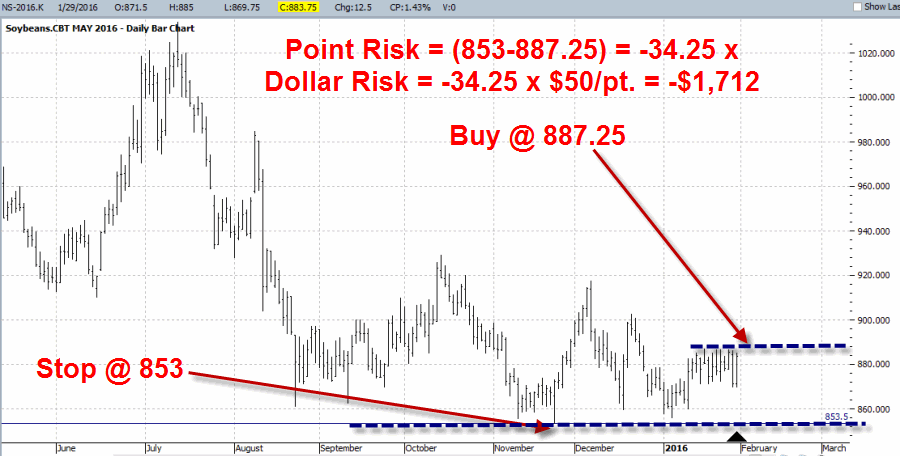
The basic “gist” of the idea is that the market in question tried repeatedly to break down below the 853-860 range but failed to break through. Thus there is a “line in the sand” support level at 853.50 as shown in Figure 4. 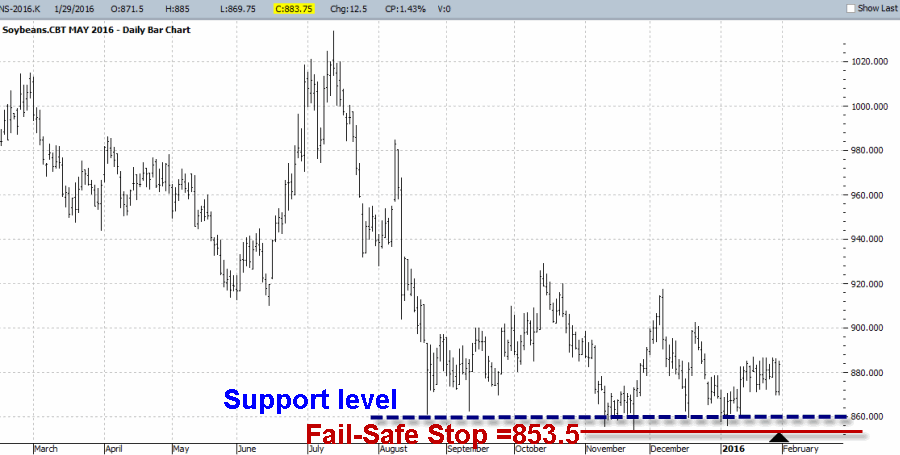
(Courtesy: ProfitSource by HUBB)
As long as price remains above the “line in the sand” a trader might consider a bullish position with a stop below that recent support level. Several choices include:
*Buy at the market – Gets you in immediately.
*Buy on a breakout above recent resistance – Forces the market to move in the right direction before getting in. Also results in buying at a higher price, i.e., greater $ risk.
*Buy on a dip closer to the “line in the sand” – Lower dollar risk by buying closer to the stop-loss level; But also exposes trader to the potential “like a hot knife through butter” scenario if the next decline is the one that actually breaks through to the downside.
*Enter a bullish position using options.
*Do nothing.
Adding Other Confirmations to the Mix
Let’s add a little more potential confirmation to the mix.
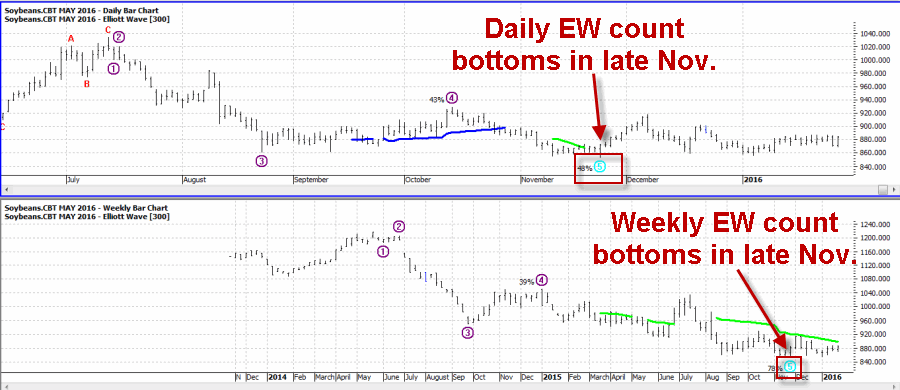
In Figure 5 we see that the weekly (top clip) and daily (bottom clip) Elliott Wave counts completed 5 waves down in late November 2015. This suggested that the major decline that beans encountered had finally (possibly) run its course. And while a new rally has yet to unfold, beans have since held their ground and attempted to build a base.
(Courtesy: ProfitSource by HUBB)
Seasonality
Let’s add one more theoretically bullish factor to the mix. As you can see in the Seasonal tendency chart for soybeans that appears in Figure 6, beans have shown a historical tendency to advance between early February and mid-June.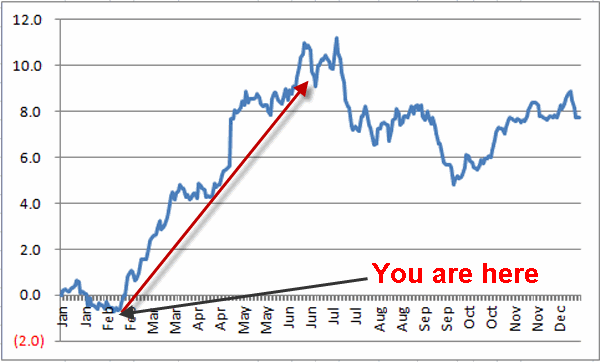
Please note the use of the words “historical” and “tendency” and the lack of the words “sure” and “thing” and “this year”. Still, we are now at the cusp of what is often the best part of the year for beans.
Putting it All Together
So what we have is this – a market that:
*Has built a strong technical base with a clearly identifiable support level
*Has completed 5 waves down on both the daily and weekly charts, and;
*Is about to enter a seasonally favorable period of several months.
Wow – this looks great! I mean, what could possibly go wrong? Ah, there’s the rub. Because nothing – no indicator, oscillator, chart pattern, wave count, or any combination thereof, i.e., nothing – is ever guaranteed to work out as suggested/hoped when it comes to trading. So let’s look at this from a no nonsense trading perspective. One hypothetical approach would be to buy the next breakout and place a stop below recent support.
As shown in Figure 7 using May soybean futures, a trader could consider buying beans if it takes out the recent high of 887 and sell if price drops below the recent low of 853.25.
(Courtesy: ProfitSource by HUBB)
This hope of course is that beans will move higher instead. But in this worst case scenario a trader would be risking $1,712.50 per contract (bean futures trade at $50 a point).
Summary
As always, this blog is intended to be “educational” and not necessarily “actionable”. In other words, the purpose of this article is not to help you decide whether or not to buy soybean futures.
The real point of this piece is to alert you to a potential pattern that can be used to trade in any number of situations:
*A technical chart pattern that that involves a market/stock/index/ETF/currency/etc. trying repeatedly to breakdown but being unable to do so.
*Combining other factors (Elliott Wave and Seasonality in this case) can help to build a stronger case.
Still one can’t but help but to wonder, are soybeans ready to rally and is it worth risking at least $1,712 to find out?
As always, only time will tell.

