I get a lot of comments from various investors wondering why I am so bullish commodities, and in particular Agriculture. They claim that commodity prices are way too high and will collapse soon enough. Who knows… maybe these investors are right.
Having said that, today I thought I’d share with you some great long term charts from the Now And Futures blog showing the nominal and inflation adjusted prices of various commodities. When I look at these charts, I wonder how on earth could some of these cheap commodities “collapse”? I mean, they are already so depressed… and so beaten down relative to history, relative to inflation, relative to other asset classes.
I think a lot of investors are stuck with their annual charts, looking back to only 365 days of the year. In my opinion it is time to look back five to six decades of data to see where we truly are.
Chart 1: Crude Oil presented in nominal and inflation adjusted prices
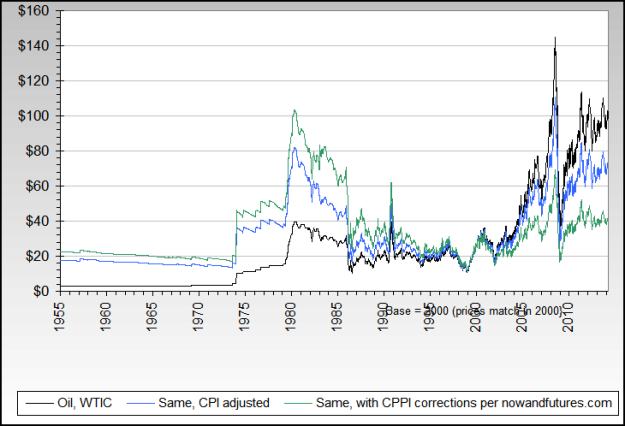
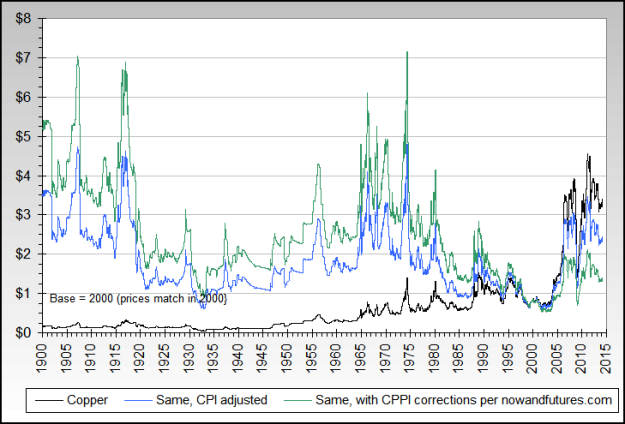
Chart 2: Copper presented in nominal and inflation adjusted prices
Chart 3: Gold presented in nominal and inflation adjusted prices
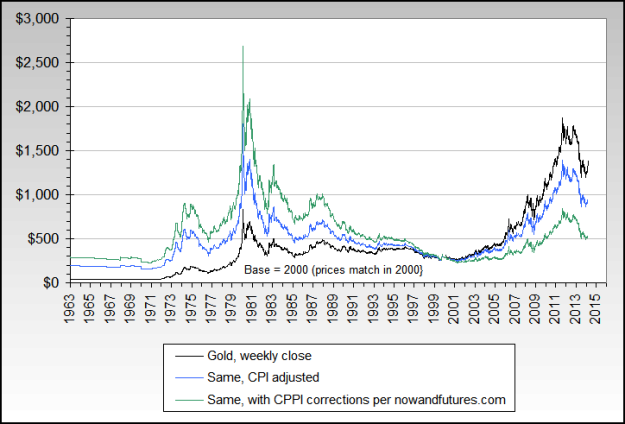
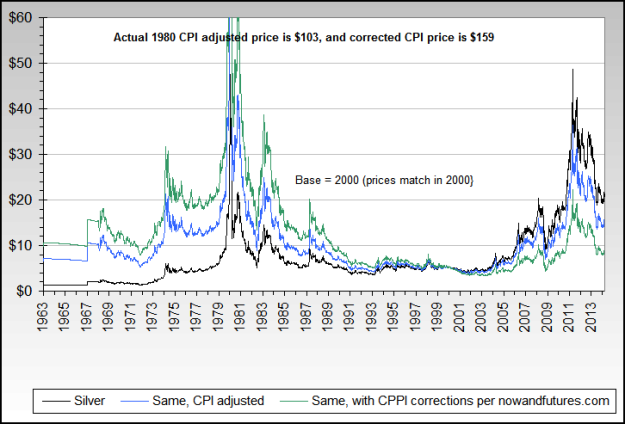
Chart 4: Silver presented in nominal and inflation adjusted prices
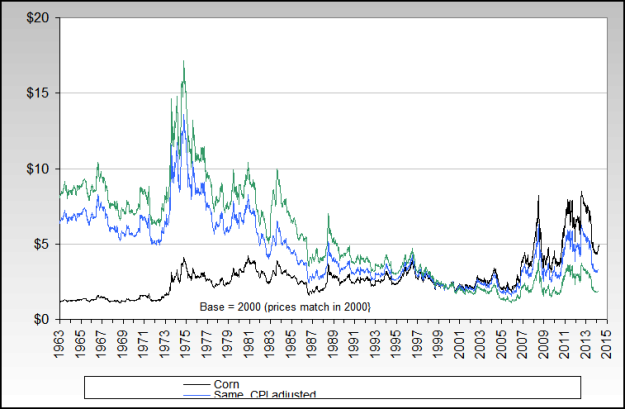
Chart 5: Corn presented in nominal and inflation adjusted prices
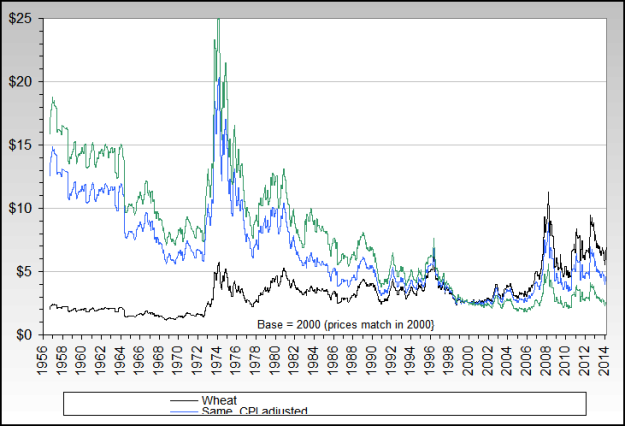
Chart 6: Wheat presented in nominal and inflation adjusted prices
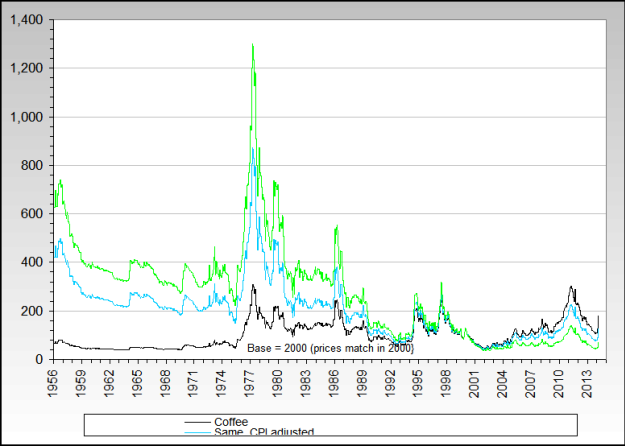
Chart 7: Coffee presented in nominal and inflation adjusted prices
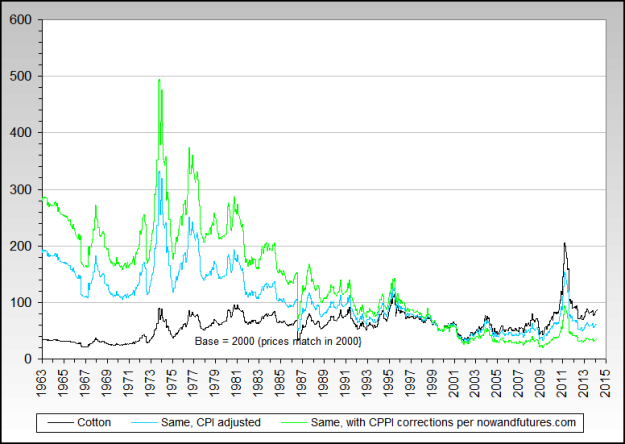
Chart 8: Cotton presented in nominal and inflation adjusted prices
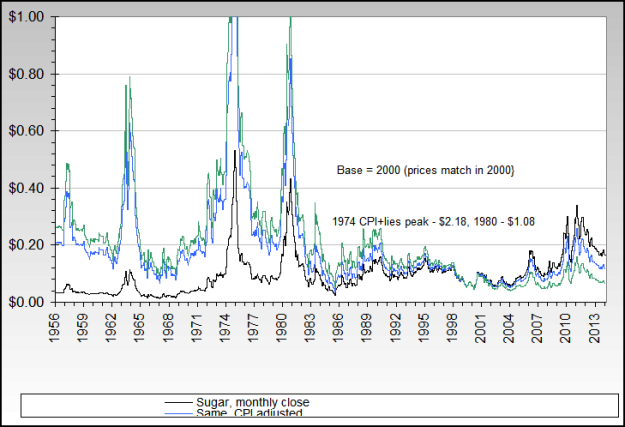
Chart 9: Sugar presented in nominal and inflation adjusted prices
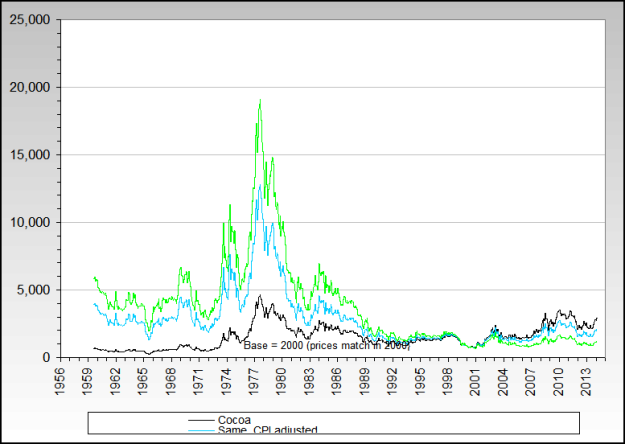
Chart 10: Cocoa presented in nominal and inflation adjusted prices
Not all commodities are created equal and they shouldn’t be valued in one basket. The same goes for stocks and the markets they trade on, not all perform equally either. As we can see in charts above, energy and industrial metals have rallied strongly over the last decade and reached levels seen during the last commodity supercycle. While I might be wrong, I do not see too much value in commodities such as Crude Oil or Copper.
On the other hand, agricultural commodities have not done that well and remain extremely cheap. And I mean EXTREMELY CHEAP. Will these ags reach those inflation adjusted levels again one day? No one really knows, maybe they will or maybe they won’t. They might rally only half way there (still a great return from current levels) or they might rally so high that it will be beyond anyone's belief (including bulls like myself), putting the 1970s boom to shame.
Just imagine Sugar prices trading above $1.00 per pound relative to 18 cents where they closed on Friday. Or imagine Cocoa prices reaching $12,000 per tonne relative to $2,990 per tonne seen during the close on Friday.

