By Chuck Mikolajczak and Sinead Carew
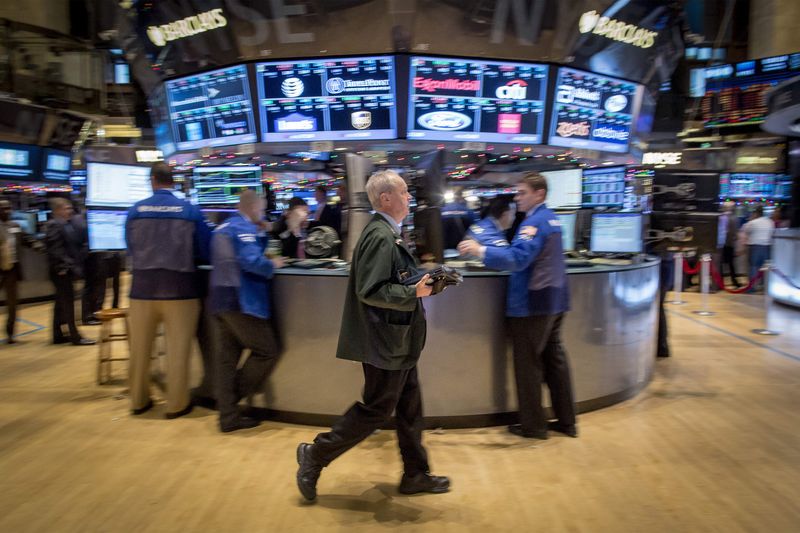
NEW YORK (Reuters) - U.S. stocks fell sharply on Friday, leaving the benchmark S&P 500 with its worst weekly performance since May 2012, as investors pulled back from the markets in response to oil's free-fall and more weak data out of China.
Oil's declines have underscored concerns about global demand, and with the S&P 500 having hit a record high only last week, investors were loath to fight the downward pressure on stocks, which accelerated in the final minutes of trading. The S&P dropped 3.5 percent on the week after seven straight weeks of gains.
The S&P energy sector <.SPNY> was down 2.2 percent on the day. It is down 16.5 percent this year, the worst performing of 10 S&P sectors. Dow components Exxon Mobil (N:XOM) and Chevron Corp (N:CVX) both hit 52-week lows as U.S. crude oil fell below $58 a barrel, hitting five-year lows, on expectations of reduced worldwide energy demand.
"Certainly as midday came the market did not stabilize at all, so sellers knew that," said Kenny Polcari, director of the NYSE floor division at O'Neil Securities in New York. "Energy is at the top of the list in terms of the names getting crushed."
The Dow Jones industrial average (DJI) fell 315.51 points, or 1.79 percent, to 17,280.83, the S&P 500 (SPX) lost 33 points, or 1.62 percent, to 2,002.33 and the Nasdaq Composite (IXIC) dropped 54.57 points, or 1.16 percent, to 4,653.60.
Disappointing data that suggested China's economy softened in November pushed the materials sector <.SPLRCM> down 2.9 percent, making it the worst-performing S&P sector on the day.
The drop in oil and weakness in China overshadowed strong U.S. consumer sentiment, which hit an eight-year high.
Some investors hope declining gas prices will boost consumer spending enough to offset the energy sector's woes.
However, there is concern that rising volatility in the energy market will migrate to equities as investors worry about slack demand worldwide. The CBOE Volatility Index, or VIX, rose 5 percent to 21.08 on Friday as investors paid up to hedge against losses.
Polcari, however, noted that the S&P 500's declines came to within a whisper of the 50-day moving average at 2,000, where he expects to see buyers emerge next week.
Adobe Systems (O:ADBE) rose 9 percent to $76.02, making it the biggest gainer on the S&P 500 after it announced plans to buy stock photography company Fotolia, along with a stronger quarterly report.
Declining issues outnumbered advancing ones on the NYSE by 2,468 to 647, for a 3.81-to-1 ratio on the downside; on the Nasdaq, 1,949 issues fell and 790 advanced for a 2.47-to-1 ratio favoring decliners.
The broad S&P 500 index posted 15 new 52-week highs and 35 new lows; the Nasdaq Composite recorded 52 new highs and 160 new lows.
About 7.6 billion shares were traded on U.S. exchanges on Friday, compared to the 6.9 billion daily average so far this month, according to BATS Global Markets data.
(Editing by Bernadette Baum, Meredith Mazzilli and James Dalgleish)
