Sign up to create alerts for Instruments,
Economic Events and content by followed authors
Free Sign Up Already have an account? Sign In
Please try another search
For the nine months ended 30 September 2019, SemGroup Corp revenues decreased 5% to $1.8B. Net loss applicable to common stockholders increased 91% to $85.4M. Revenues reflect Corporate & Other-Product sales segment decrease from $31.3M to $0K, Corporate & Other-Storage fees segment decrease from $7.8M to $0K. Higher net loss reflects Depreciation and amortization increase of 18% to $184.5M (expense).
| Period Ending: | Sep 30, 2019 | Jun 30, 2019 | Mar 31, 2019 | Dec 31, 2018 |
|---|---|---|---|---|
| Total Revenue | 562.41 | 674.94 | 567.23 | 611.86 |
| Gross Profit | 185.24 | 181.36 | 163.86 | 165.86 |
| Operating Income | 29.9 | 17.59 | 27.46 | 49.91 |
| Net Income | -12.51 | -25.59 | -6.84 | 0.55 |
| Period Ending: | Sep 30, 2019 | Jun 30, 2019 | Mar 31, 2019 | Dec 31, 2018 |
|---|---|---|---|---|
| Total Assets | 6112.63 | 6257.94 | 6374.04 | 5210.31 |
| Total Liabilities | 4218.12 | 4312.83 | 4396.92 | 3359.82 |
| Total Equity | 1894.51 | 1945.11 | 1977.12 | 1850.49 |
| Period Ending: | Sep 30, 2019 | Jun 30, 2019 | Mar 31, 2019 | Dec 31, 2018 |
|---|---|---|---|---|
| Period Length: | 9 Months | 6 Months | 3 Months | 12 Months |
| Cash From Operating Activities | 134.72 | 29.89 | 52.84 | 269.7 |
| Cash From Investing Activities | -774.04 | -681.02 | -585.31 | -229.67 |
| Cash From Financing Activities | 763.34 | 814.01 | 786.59 | -45 |
| Net Change in Cash | 127.35 | 166.27 | 256.9 | -7.04 |

Unlock access to over 1000 metrics with InvestingPro
View advanced insights on financial statements, including growth rates and metrics that provide an in-depth view of the company's historical and forecasted financial performance.

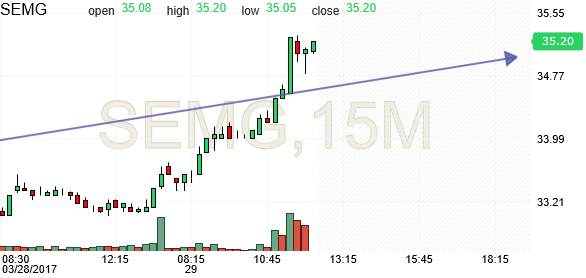
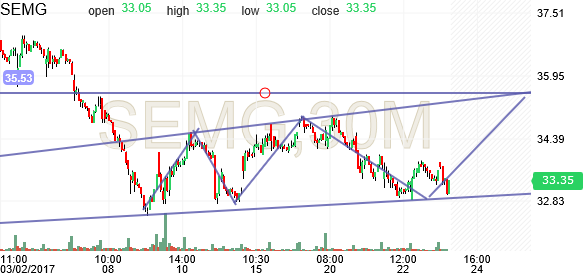
 up to $35.20 now time to put a SL and watch for a breakout above the line wile profits are locked in.
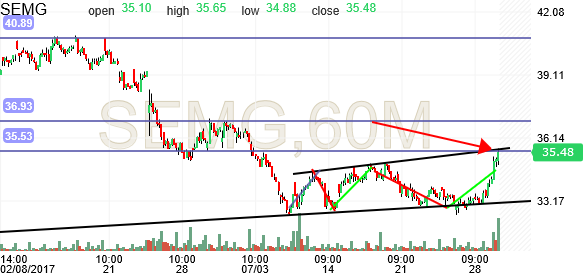
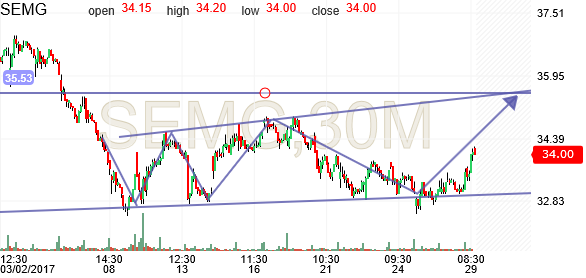
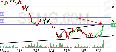 And there you have it Target hit now to watch for breakout and upper target levels to watch for a bounce down off of.
Are you sure you want to block %USER_NAME%?
By doing so, you and %USER_NAME% will not be able to see any of each other's Investing.com's posts.
%USER_NAME% was successfully added to your Block List
Since you’ve just unblocked this person, you must wait 48 hours before renewing the block.
I feel that this comment is:
Thank You!
Your report has been sent to our moderators for review