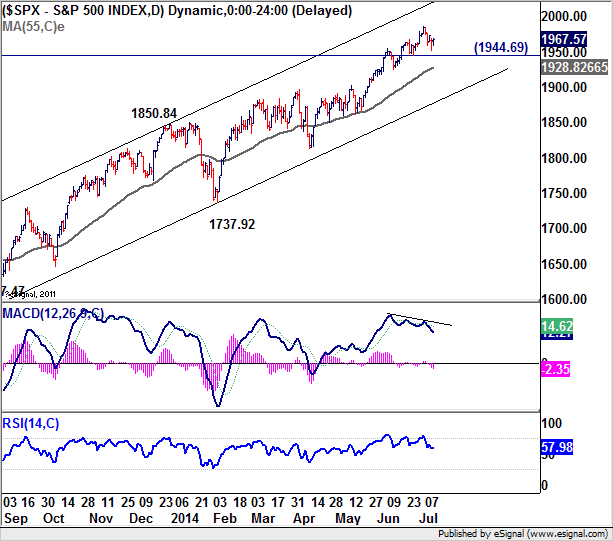
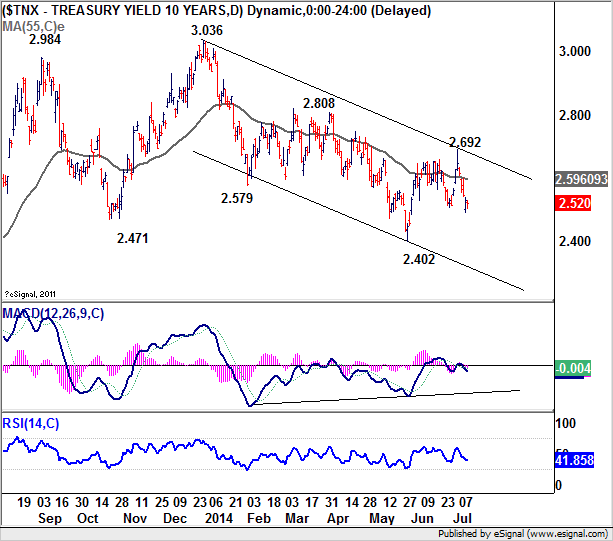
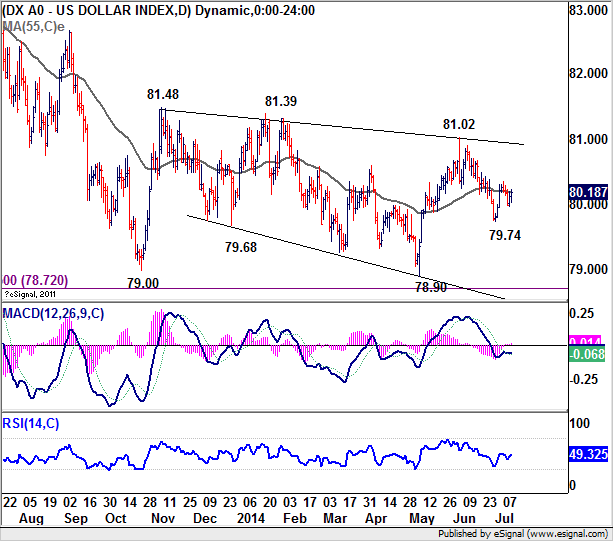
The financial markets were rocked by risk aversion last week on new of missed debt payments by a company related to a major Portugal bank. The Dow dipped to as low as 16805 from the weekly high of 17068.8 before closing at 16943.8. The S&P 500 also dipped to as low as 1952.86 before closing at 1967.57. More volatility was seen in treasury yields as 10 year yield closed at 2.52 comparing to prior week's high of 2.692. 30 year yield closed at 3.343 comparing to prior week's high of 3.516. Gold seemed to have benefited form the risk averse sentiments and reached as high as 1346.8 before closing at 1337.4. Crude Oil, on the other hand, dived sharply to as low as 100.44 before closing at 102.19. The Dollar Index was stuck in range around 80 handle. In the currency markets, Yen ended as the second strongest currency on risk aversion, just next to the New Zealand dollar. The Canadian dollar was the weakest one after poor economic data. Other major currencies were mixed.
To have a quick recap on the key fundamental events, The FOMC minutes for the June meeting was non-eventful with policymakers giving little guidance on the expected timing of any rate hike cycle more in Fed To End Tapering In October, No Hints On First Rate Hike. The BoE left interest rates unchanged at 0.50% and kept the asset purchase target at GBP 375b. UK production data was disappointing with industrial production dropped -0.7% mom, rose 2.3% yoy, manufacturing production dropped -1.3% mom, rose 3.7% in May. Both were well below expectations. Swiss CPI missed consensus and slowed to 0.0% yoy in June. Canadian job market contracted by -9.4k in June comparing to expectation of 24.0k. Unemployment rate also rose to 7.1% versus consensus of being unchanged at 7.0%. Ivey PMI unexpectedly deteriorated to 46.9 in June. Australian employment data was mixed with 15.9k growth in June but unemployment rate rose to 6.0%.
Let's have a look at some technical developments. S&P 500 lost some upside moment as seen in bearish divergence condition in daily MACD. However, it's held well above 1944.69 support so far and thus there is no confirmation of near term reversal yet. And, the index is also staying comfortably above the rising 55 days EMA and inside the medium term channel. Thus, the up trend is still intact for 2000 psychological level and above.

U.S. 10-Year Yield, TNX, broke 2.507 support last week and that argues that rebound from 2.402 is completed at 2.692. The development also suggests that the corrective fall fro 3.036 is not over yet. More downside is now in favor in near term back towards 2.402 low. Though, as downside momentum is a bit unconvincing, we'd likely see strong support from 2.402 to bring rebound.

Recent development in the dollar index is rather mixed as it struggled to find a clear direction after hitting 55 days EMA. Also, it's now close to 55 weeks EMA too. We'd expect some more sideway trading in near term. Though, a break of 79.74 will pave the way for a test on key long term support zone at 78.72.

Regarding trading strategies, one of the major question is whether we'd go short in yen crosses this week. As mentioned above, the up trend in stocks remained intact. And last week's dip would likely be a pull back rather than a reversal. Also, the USD/JPY is still holding on to key support zone around 100.65. Thus, we'd prefer not to sell the USD/JPY. The outlook in dollar index and the EUR/USD is rather neutral in near term and both are struggle in familiar range. Thus, we also prefer not to sell the EUR/JPY even though the near term outlook is mildly bearish. The GBP/JPY has been a tricky one as it was support in recent weeks by strength in sterling. Last week's dip was seen as an early sign of topping but we'd prefer to see break of 172.36 support to confirm. So, in general, we'd avoid selling yen crosses first.
The EUR/GBP recovered from 0.7914 last week. The price actions from 0.7914 look corrective and the cross struggled to take out 4 hours 55 EMA so far. Thus, we'll hold on to the short position in the EUR/GBP for another fall. However, we'd also point out the bullish convergence condition in 4 hours MACD, which indicates lost of downside moment. Thus, we'd close out the short position on the next decline after breaking 0.7914 temporary low.
The strong rebound in last week provide that we're correct in closing out the short trade. Nonetheless, our short AUD/CAD was losing as Aussie recovered on its own employment data. But after all, we're holding on to the bearish view that the corrective fall from 1.0349 isn't over yet. This is also inline with the view that the AUD/USD's correction from 0.9504 is going to extend lower with another fall. Thus, we'll stay short in the AUD/CAD with stop at 1.0120. We'd anticipate another fall to extend the decline from 1.0349 in a latter stage.
