The trading environment for XP Power Ltd (LON:XPP) has become more uncertain in recent months, with the US imposing higher tariffs on imports from China and threatening tariffs on imports from Mexico. At the same time, demand for semiconductors and consequently semiconductor equipment remains weak. We have revised down our revenue and EPS forecasts to reflect the combination of weaker demand and pressure on margins; despite this the valuation does not look challenging.

Trade tariff situation worsens
In May, the US increased trade tariffs from 10% to 25% on a variety of goods imported from China, including XP’s power converters. At the same time, China has imposed tariffs on imports from the US. As XP manufactures in China and Vietnam, not all US imports of XP products incur the tariffs. XP is trying to mitigate the effect by qualifying more products in Vietnam, but this process takes time and in the meantime, the tariffs are creating uncertainty and pressure on margins. While the tariffs on Mexican imports to the US have been suspended for now, these could be reinstated and while not affecting XP directly, they could negatively affect demand for capital equipment in the US.
Semiconductor market still subdued
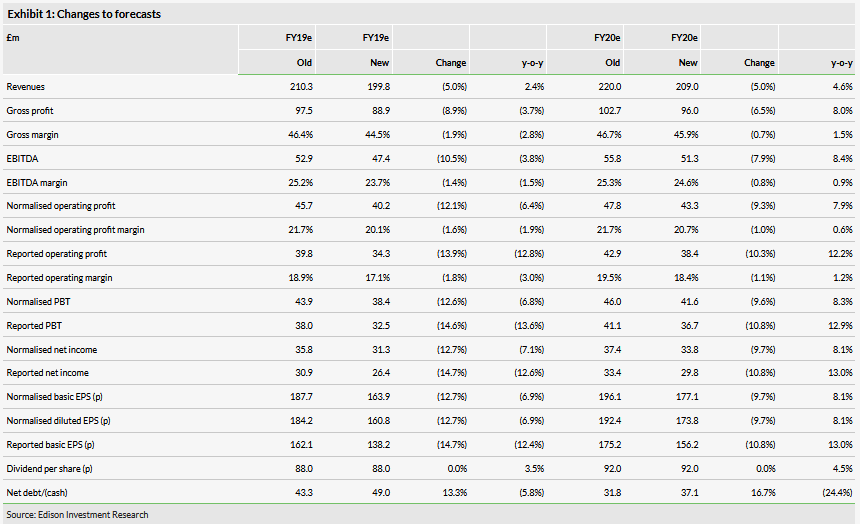
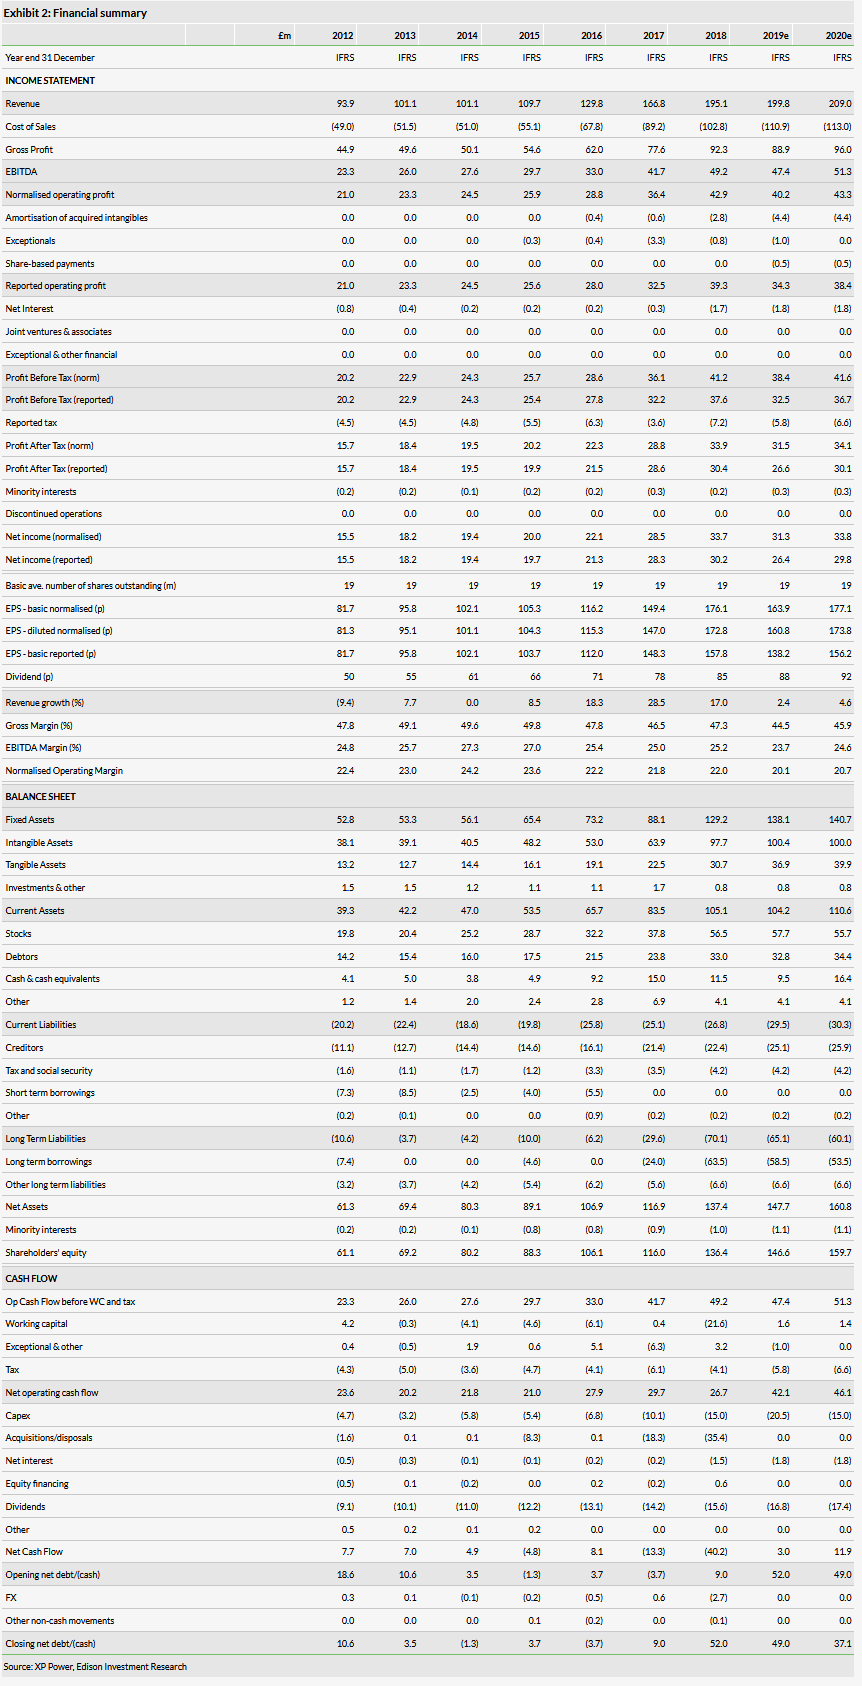
Reports from semiconductor production equipment manufacturers in recent months confirm that demand for semiconductor equipment remains weak. While logic and foundry chip manufacturers are seeing signs of improvement, the memory market continues to suffer from oversupply. The bottom in the market has not yet been confirmed and could shift out further into H219. On the back of the tariff situation and weaker demand for semiconductors, we have revised down our forecasts. In FY19, we now factor in a 20% decline in the semiconductor business and reduce growth in the rest of the business from 5% to 2.5%, which cuts revenues by 5% in FY19 and FY20 and reduces normalised EPS by 12.7% in FY19 and 9.7% in FY20. While our net debt forecast increases, we estimate that net debt/EBITDA will only increase from 0.8x to 1.0x by the end of FY19.
Valuation: Share price already factoring in weakness
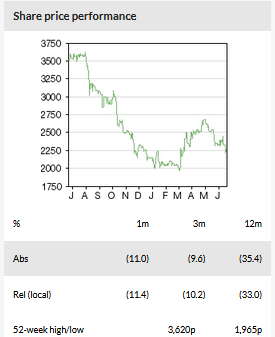
The share price has pulled back from its year-to-date high of 2,670p at the end of April reflecting the weaker trading environment. On our revised forecasts, XP is trading on a P/E of 14.1x for FY19e and 13.0x FY20e, still at a substantial discount to power converter peers as well as UK electronics companies. XP’s dividend yield is also at the top end of the peer group range.

Business description
XP Power is a developer and designer of power control solutions with production facilities in China, Vietnam and the US, and design, service and sales teams across Europe, the US and Asia.
Changes to forecasts

