Trading recommendations
Buy Stop 1227.00. Stop-Loss 1217.00. Objectives 1270.00, 1283.00
Sell in the market. Stop-Loss 1227.00. Objectives 1200.00, 1160.00, 1100.00, 1048.00, 1000.00
Overview and Dynamics
Immediately after it became clear that Donald Trump becomes President of the United States, investors began to withdraw funds from defensive assets such as the yen and precious metals, government bonds and invest in the dollar and US stocks. Risk appetite after the victory of Donald Trump's presidential election in the United States began to grow again. On Thursday, the yield on 10-Year Treasury bond rose to 2.118%, and recorded the maximum increase of four since June of 2013.
The top gainers last week were shares of industrial companies and banks. The most popular events, which, according to investors, may benefit from the increase in public spending, reduce regulation and increase in inflation during the Trump presidency. For the week DJIA gained 5.4%, which was for him the highest result since December 2011. The S&P 500 and the Nasdaq Composite added this week by 3.8%. The sub-index of industrial companies as part of S&P 500 has risen over the past week by 8%, while the financial sector sub-index - 11%.
According to economists, Trump intends to pursue protectionist policies against trafficking and immigration controls, which may increase inflation. The market also takes into account quotations fiscal stimulus, implying a tax cut for companies and investments in infrastructure.
Gold prices came under significant pressure. The dollar index Wall Street Journal, which tracks the US dollar's value against a basket of 16 currencies, rose by a further 0.3% on Friday. Stronger dollar makes gold is more expensive for holders of other currencies.
According to the quotations of futures on a bet the Fed, investors assessed the probability of a December tightening of monetary policy in the 81.1%. Published in late October, the data indicated that core inflation in the US in Q3 reached a two-year high.
Trump Economic Development Plan of the US economy will contribute to higher inflation and, consequently, enhance the probability of rate hikes by the Fed. And this is the most direct way is putting pressure on gold.
Gold prices in the US on Friday fell to a 5-week low, completing trades on COMEX was down 3.3%, at the level of 1224.30 US dollars per troy ounce, the lowest closing level since June 3. Today the gold price quotes again falling for the sixth consecutive session, showing the most significant intraday decline in almost three years. The pressure on the precious metals, including gold, does not weaken, and probably will grow.
Technical analysis
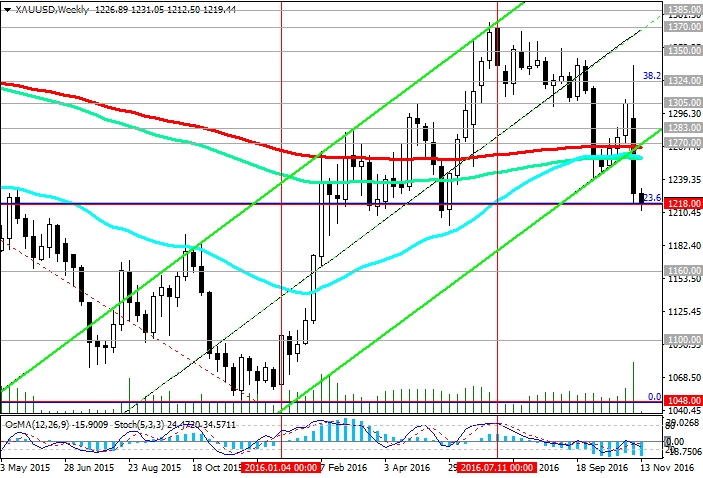
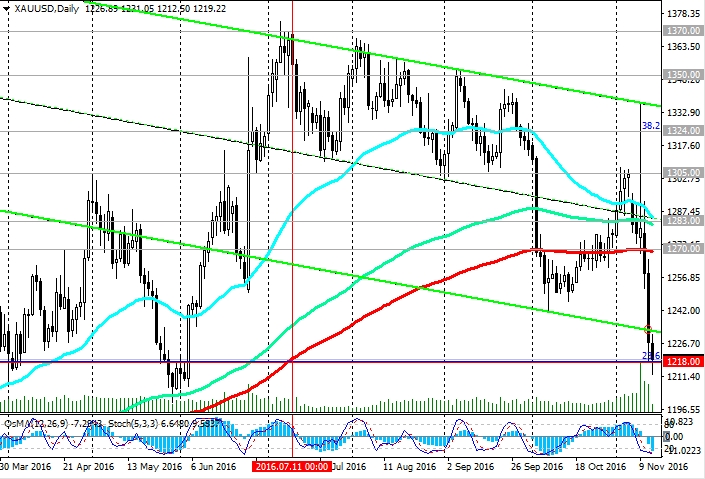
Against Trump wins and the highest volatility in the financial markets, the price of gold fell sharply in recent days. The pair XAU/USD has broken the important support levels of 1283.00 (EMA144 on the daily chart), 1270.00 (EMA200 on daily and weekly charts) and to find support at 1218.00 (23.6% Fibonacci level of the correction to the wave decline from October 2012). The pressure on gold continues unabated. Break of the support level of 1218.00 (23.6% Fibonacci level) will create preconditions for the further decrease in pair XAU/USD and return to the downward global trend, which began in October 2012.
Alternative scenario implies a return above the key level of 1270.00. Only in this case, you can revert to the long positions in the pair XAU/USD . Then the sample resistance level 1283.00, 1305.00, 1324.00 (38.2% Fibonacci level) will create prerequisites for the growth to the levels of 1350.00, 1370.00, 1385.00, 1400.00. So far, the actual look short positions. Indicators OsMA and Stochastic on the 4-hour, daily, weekly, monthly charts are on the side of the sellers. XAU/USD pair further reduction objectives are 1100.00 levels (EMA144), 1000.00 (EMA200 monthly chart).
Support levels: 1218.00, 1200.00, 1160.00, 1100.00, 1048.00, 1000.00
Resistance levels: 1270.00, 1283.00, 1305.00, 1324.00, 1350.00, 1370.00, 1385.00, 1400.00


