Crude Oil gained strongly yesterday, in line with various stronger economic numbers that was released yesterday. However, the bullish impact on Stocks wasn’t as great, suggesting that there was something else that fueled yesterday’s rally. If we factor in the fact that implied demand for Crude was actually lower based on latest Department of Energy Inventory numbers, the rally becomes even more inexplicable. Perhaps market was forgiving about the 2 million barrel miss for Crude Inventory, and instead focus on the higher implied demand in Distillates and Gasoline, which came in 450K barrels and 1.4 million barrels lower than expectation respectively. Unrest in Middle East continue to pressure Crude prices, but it is unlikely that we have a proper case for such attribution as there wasn’t any new development on the US political front.
Hourly Chart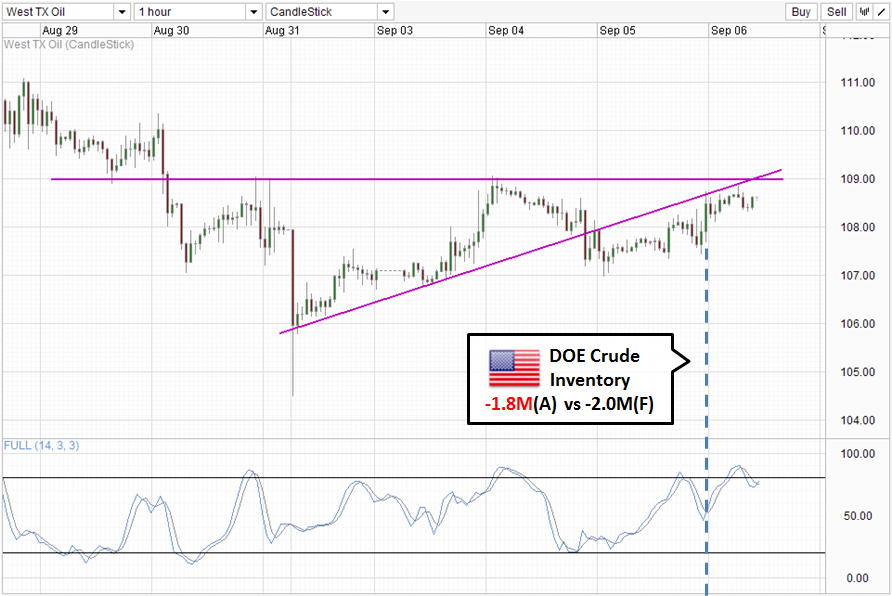
Hence, the above suggest that we do not truly have good reasons for WTI Crude prices to increase, at least not right now. This would limit prices ability to break the 109.0 resistance which is incidentally this week’s ceiling. Furthermore price is trading below the ascending trendline, with price touching it during early Asian session which was promptly sent lower once again, showing that the bearish influence of the trendline remains strong. Stochastic readings also suggest that we are currently in a bearish cycle. Stoch curve may be pointing higher right now, but that could simply be an interim trough and as such should not be regarded as a proper bullish signal unless we breach back within the Overbought region again which will likely coincide with a break of 109.0. If the Stoch bearish cycle signal is correct, we could see price moving towards 107.0 which is the 1st bearish target. A break of which may send prices closer to 105.0.
Daily Chart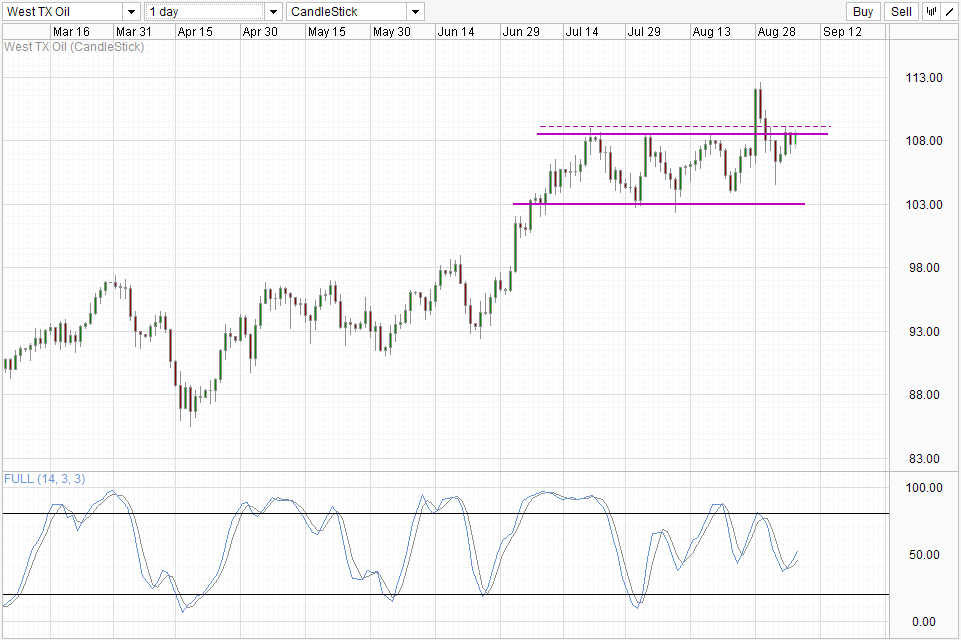
Once again nothing new on the daily chart. Prices is currently straddling the 108.5 resistance which extends to 109.1 based on the candlesticks wick. Stochastic readings here provides a stronger bullish signal compared to the Hourly Chart’s due to the divergence seen where this trough is lower than the previous 2, but current price dip is actually higher than the previous 2. Hence there is a potential sign that the sell off since 29th August may be too extreme, which bodes well for bullish correction. In order to affirm this bullish Stoch signal, readings should preferably push above the 50.0 mark which is the confluence with the previous trough level. However, if Stoch readings actually taper off around 50.0, we could see prices heading towards the 103.0 floor.
Original post
- English (UK)
- English (India)
- English (Canada)
- English (Australia)
- English (South Africa)
- English (Philippines)
- English (Nigeria)
- Deutsch
- Español (España)
- Español (México)
- Français
- Italiano
- Nederlands
- Português (Portugal)
- Polski
- Português (Brasil)
- Русский
- Türkçe
- العربية
- Ελληνικά
- Svenska
- Suomi
- עברית
- 日本語
- 한국어
- 简体中文
- 繁體中文
- Bahasa Indonesia
- Bahasa Melayu
- ไทย
- Tiếng Việt
- हिंदी
WTI Crude: Facing 109.0 Resistance
Published 09/06/2013, 02:28 AM
Updated 07/09/2023, 06:31 AM
WTI Crude: Facing 109.0 Resistance
3rd party Ad. Not an offer or recommendation by Investing.com. See disclosure here or
remove ads
.
Latest comments
Install Our App
Risk Disclosure: Trading in financial instruments and/or cryptocurrencies involves high risks including the risk of losing some, or all, of your investment amount, and may not be suitable for all investors. Prices of cryptocurrencies are extremely volatile and may be affected by external factors such as financial, regulatory or political events. Trading on margin increases the financial risks.
Before deciding to trade in financial instrument or cryptocurrencies you should be fully informed of the risks and costs associated with trading the financial markets, carefully consider your investment objectives, level of experience, and risk appetite, and seek professional advice where needed.
Fusion Media would like to remind you that the data contained in this website is not necessarily real-time nor accurate. The data and prices on the website are not necessarily provided by any market or exchange, but may be provided by market makers, and so prices may not be accurate and may differ from the actual price at any given market, meaning prices are indicative and not appropriate for trading purposes. Fusion Media and any provider of the data contained in this website will not accept liability for any loss or damage as a result of your trading, or your reliance on the information contained within this website.
It is prohibited to use, store, reproduce, display, modify, transmit or distribute the data contained in this website without the explicit prior written permission of Fusion Media and/or the data provider. All intellectual property rights are reserved by the providers and/or the exchange providing the data contained in this website.
Fusion Media may be compensated by the advertisers that appear on the website, based on your interaction with the advertisements or advertisers.
© 2007-2024 - Fusion Media Limited. All Rights Reserved.