How much money can you lose on any given day according to an entire squadron of dynamic variable factors?
It’s called value at risk (VAR), and because every hedge fund, investment bank, prop house, and algo firm wants to assess their own risk — while at the same time sneakily wanting to know how the rest of the market is assessing and quantifying their own risk — the models are all built on much the same inputs and, as such, are basically mirrors of each other.
So you see VAR models eventually conform to the very thing they’re designed to protect us against. You see they are mostly like milk bottles — exactly the same, and they’re used widely, because they’re widely used. Understand?
Good!
Back when I had more hair… actually any hair, and I didn’t have to do 200 bloody sit-ups everyday just to keep flab from attaching itself to my stomach like some unwanted starved leech, I worked for a firm who, in order to protect their anonymity, I’ll just call PMJordan.
Anyway, while working at Lucifer, I worked on a project with the quants who built these VAR models.
These were very, very smart people. They were so smart that normal people had difficulty communicating with them.
One guy, who I’ll call “Frenchie” (to protect the anonymity of his origins), could explain parabolic curve theory to you with exquisite detail while simultaneously solving math problems in his head in mere seconds. Problems, I might add, which I would need a spreadsheet, half an hour, and intense frowning to complete.
What solidified my faith in his planet-sized brain was the fact that he was so awkward and almost completely incapable of social engagements. After the head of Lucifer in the London office addressed him, he promptly gazed up, flinched awkwardly, and stared out the window. Clearly a genius.
And “Frenchie” wasn’t the only one, because quants just like him can be found across the investment landscape developing VAR models and staring into space while their brains whirr and click away. But still, with all this brain power VAR models continue to be proven crap.
VAR models never managed to help those caught off balance when the CHF broke, and they never helped those caught off balance with Brexit.
Part of the problem, I suspect, is that in order to develop them you need a whopping great data set. Clearly the statistics based on data over, say, 10 years is better than that of 5, 100 better than 50, and so on.
One of my team here at Capitalist Exploits HQ referred me to the work of one Paul Schmelzing. Schmelzing is a visiting scholar at the Bank of England from Harvard University where he concentrates on 20th century financial history and he wrote an excellent piece on the history of bond bubbles going all the way back to the 1285. THAT’s a decent data set!
Probably the most important takeaway from Paul’s work — for me at least — is that at no period in history has there ever been the sort of bat sh*t crazy central bank intervention in the bond markets we’ve enjoyed in the last decade or so. VAR models don’t account for this.
That quite literally means that this time it is different.
I nicked this chart from Paul’s work. It provides us a clear picture over hundreds of years and thus puts things into perspective very nicely.
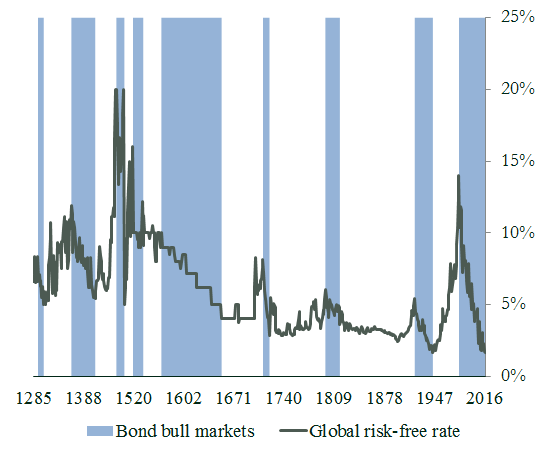
So here we sit in 2017 with some interesting data points, namely that back in July of last year the peak in the bond cycle was reached. Remember when I ranted about how bonds were trading as commodities?
Well, that was just one month after the peak in bonds. When we had over $13 trillion in bonds trading at negative yields. This was the lowest level the risk free rate has ever reached in sovereign bond market history in 800 years.
This is one of the most remarkable bond bull market in all of recorded history. Lucky us!
Does this sound crazy? I think so.
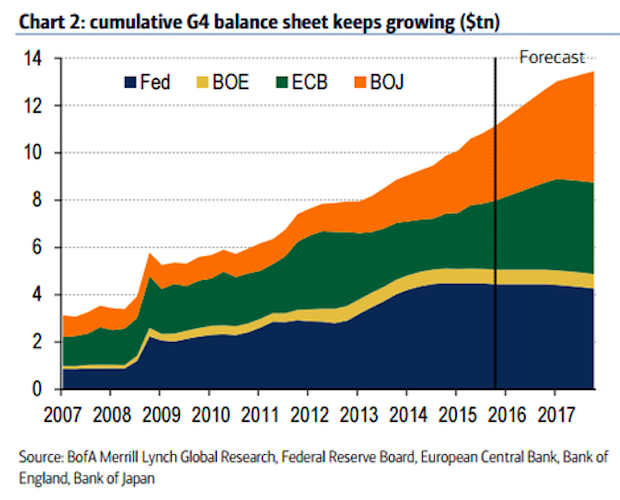
How we got here? Fiscal expansion – the flip side of the bond bull market. Here we have the FED (US), the BOE (UK), ECB (EU), and BOJ (Japan)
There are a few things that turn any market. In the bond market, there are 3 that come to mind:
- Inflation is one of those things
- Geopolitical events are another
- Volatility is the third
Let’s look at all three.
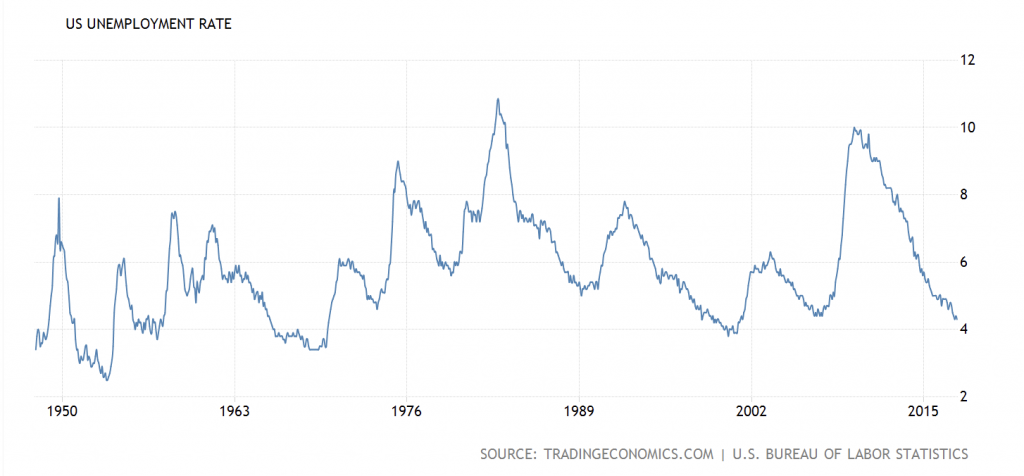
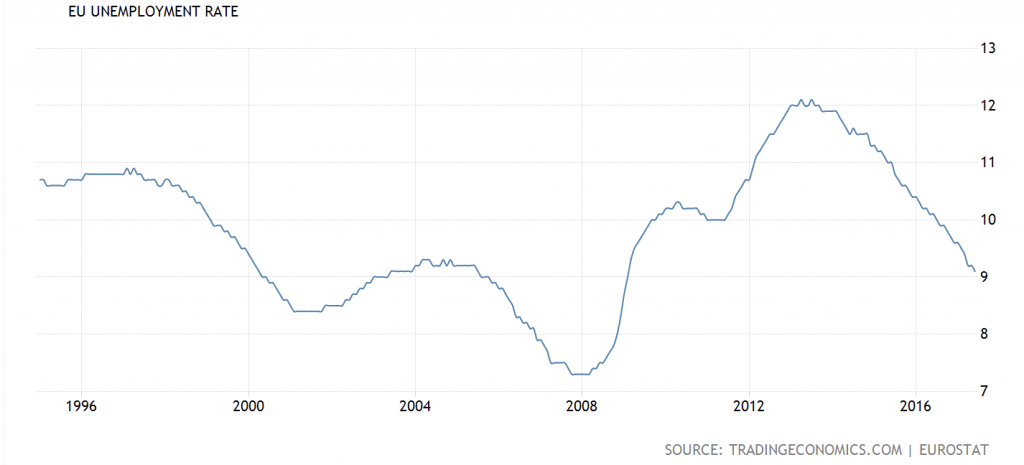
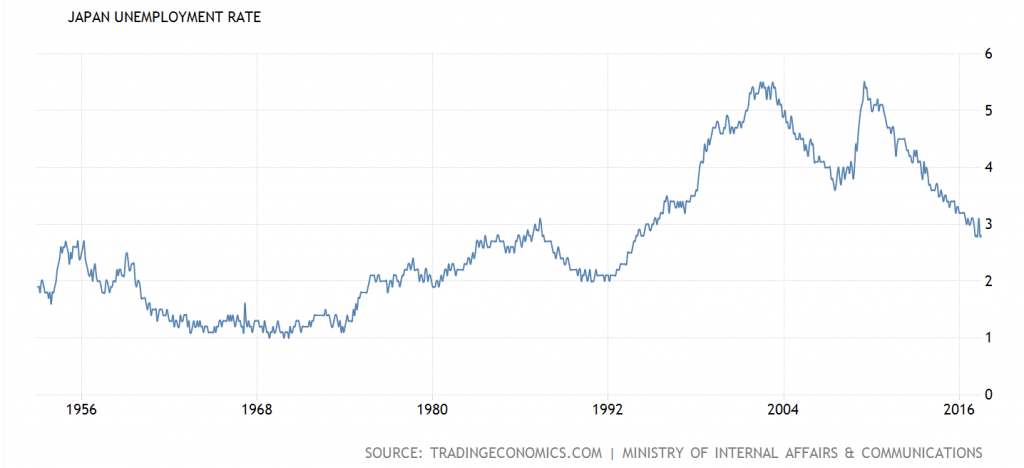
Let’s take a look at unemployment rates — historically very closely tied with inflation. The second lowest rate since the late 60’s. Mmmm…
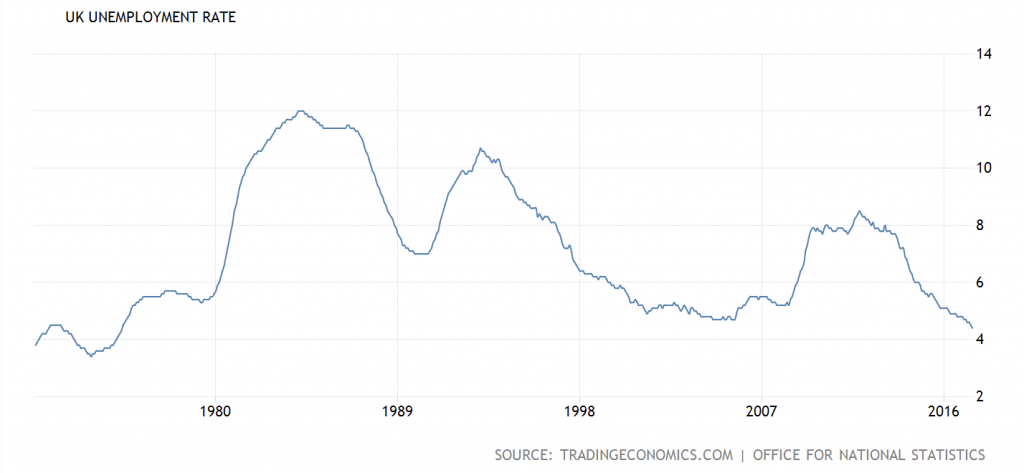
In the UK, we have to go back to the 70’s to find lower unemployment figures:
The EU is not faring as well but the trajectory and trend are clear:
And Japan? Same trend:
Where are you going with all this, Chris?
China just printed a 5.5% PPI number.
And over in the US….This just out from Bloomberg.
U.S. second-quarter growth was revised upward to the fastest pace in two years on stronger household spending and a bigger gain in business investment, putting the economy on a stronger track, Commerce Department data showed Wednesday.
- Gross domestic product rose at a 3% annualized rate from prior quarter (est. 2.7%); revised from initial estimate of 2.6%
- Consumer spending, biggest part of the economy, grew 3.3% (est. 3%), most since second quarter of 2016 and revised from 2.8%
- Nonresidential fixed investment rose 6.9%, revised from initial increase of 5.2%
- Corporate pretax earnings rose 7% y/y; up 1.3% q/q
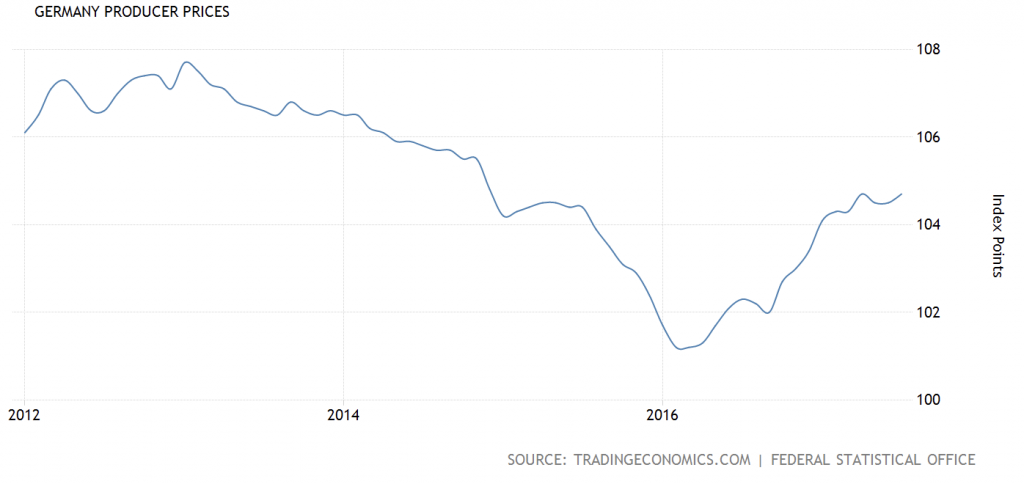
And… our sauerkraut-eating, beer-swilling friends are experiencing the highest rate of accelerating inflationary growth in the last 23 years:
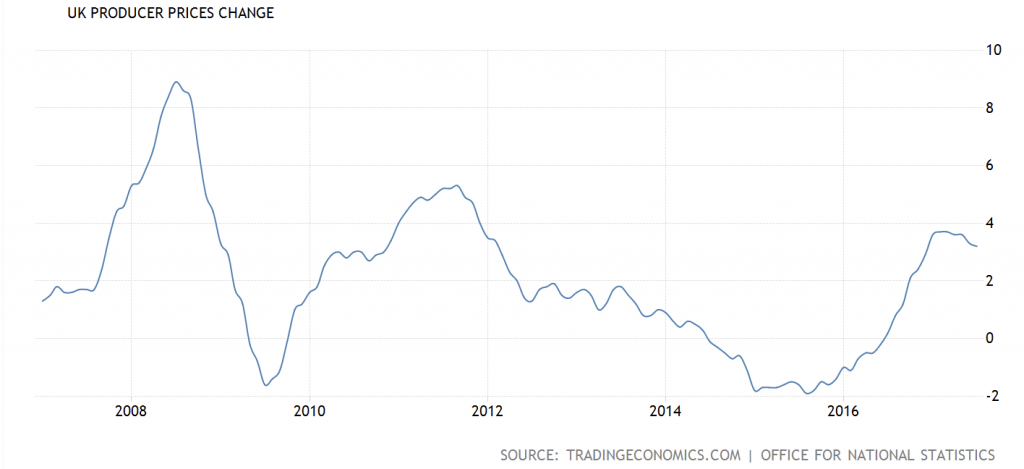
Our pasty friends in the UK? Bam!
Ok, so now we have all of this taking place.
Inflation being not so benign… central bankers actually getting what they want… while geopolitical risks, which I don’t have time to discuss here today but have written about extensively, are far higher than the market is pricing. And almost nobody seems to be paying much attention to them!
The connection between the structural political breaks and how these affect and feed both central bank policies and market participants behaviour is, I think, one of the most critical elements that bond investors are not considering.
Remember, both inflation or geopolitical shocks can impact the bond markets negatively. And what about the third one?
Volatility. Well, take a look for yourself.
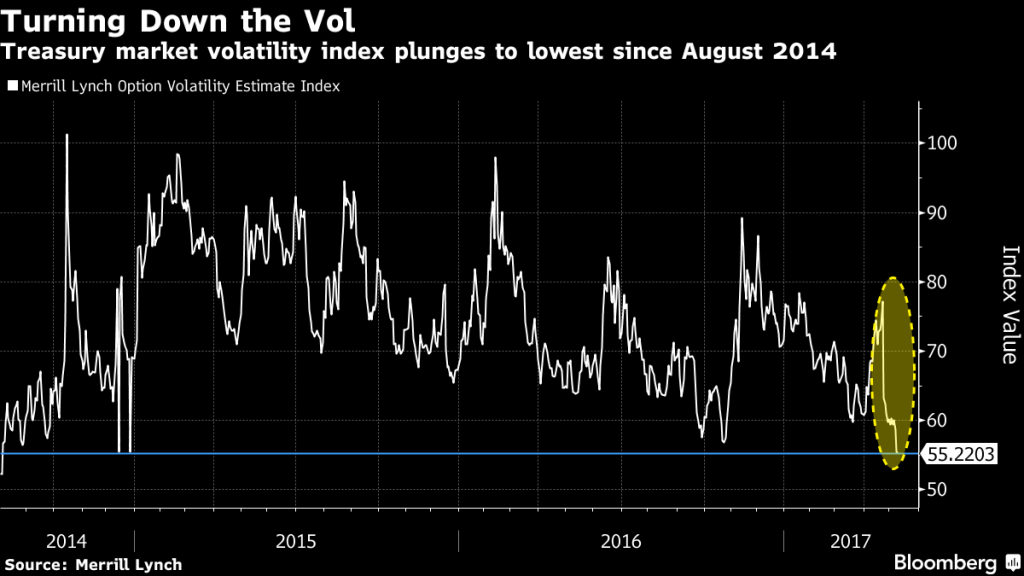
Given that the treasury market volatility index just plunged again, the answer is that there are still trillions of dollars out there that believe in reward free risk. Are those planet sized brains building VAR models going to get it wrong again?
