Get 40% Off
🚨 Volatile Markets? Find Hidden Gems for Serious OutperformanceFind Stocks Now

Will The Gold To Silver Ratio Peak In 2015?

Published 01/11/2015, 02:24 AM
Updated 07/09/2023, 06:31 AM

Both gold and silver have been under selling pressure for a majority of the past few years. However, last year, silver prices were hit much harder than gold prices. In fact, gold was down just over one percent on the year while silver fell nearly 20 percent. This got me thinking about the gold to silver ratio (price per ounce of gold divided by price per ounce of silver).

But, before I touch on the ratio, let’s take a look at how the metals performed last year:

Gold vs Silver Performance Chart – 2014
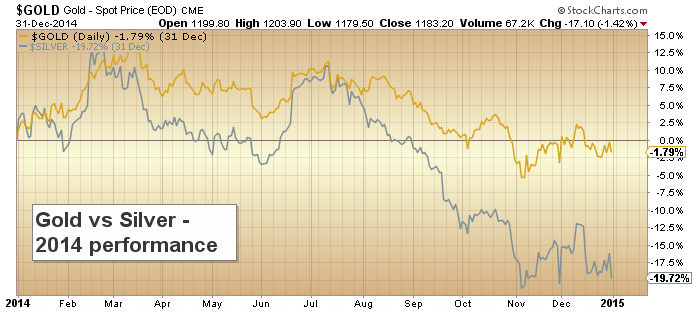
Gold vs Silver, Daily 2014

Silver’s underperformance in 2014 is pretty glaring. And this acceleration has pushed the gold to silver ratio toward an extreme. Based on the chart below, it is likely that silver will begin to outperform gold at some point in 2015. This is due to the Relative Strength Index (RSI) of the ratio nearing a point where a reverse in trend has occurred in the past.

I wrote about this on my tumblr last week, but wanted to share some of the implications of the Gold to Silver ratio here:

  • The chart does NOT imply that a rally in silver prices is imminent; it simply indicates that it should begin to perform better than gold at some point in 2015.
  • As deflation concerns continue to swirl, precious metals are still an ‘out of favor’ asset class. A bottom for both gold and silver will depend on several variables, but here are a few that would likely boost precious metals: a return of broad-based global growth, a softer dollar, AND/OR a rise in geopolitical tensions.
  • If/When silver begins to outperform gold, it will likely be a positive indicator for precious metals. Silver is like Gold’s high-beta brother. Therefore, an uptick in silver performance should bode well for precious metals investors. But until then…
3rd party Ad. Not an offer or recommendation by Investing.com. See disclosure here or remove ads .

Gold to Silver Ratio Chart – 1980-Present
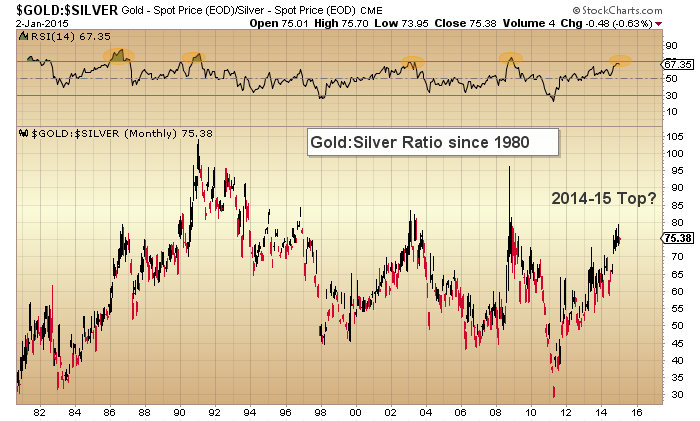
Gold:Silver Monthly 1980-Present

Original post

Latest comments

Risk Disclosure: Trading in financial instruments and/or cryptocurrencies involves high risks including the risk of losing some, or all, of your investment amount, and may not be suitable for all investors. Prices of cryptocurrencies are extremely volatile and may be affected by external factors such as financial, regulatory or political events. Trading on margin increases the financial risks.
Before deciding to trade in financial instrument or cryptocurrencies you should be fully informed of the risks and costs associated with trading the financial markets, carefully consider your investment objectives, level of experience, and risk appetite, and seek professional advice where needed.
Fusion Media would like to remind you that the data contained in this website is not necessarily real-time nor accurate. The data and prices on the website are not necessarily provided by any market or exchange, but may be provided by market makers, and so prices may not be accurate and may differ from the actual price at any given market, meaning prices are indicative and not appropriate for trading purposes. Fusion Media and any provider of the data contained in this website will not accept liability for any loss or damage as a result of your trading, or your reliance on the information contained within this website.
It is prohibited to use, store, reproduce, display, modify, transmit or distribute the data contained in this website without the explicit prior written permission of Fusion Media and/or the data provider. All intellectual property rights are reserved by the providers and/or the exchange providing the data contained in this website.
Fusion Media may be compensated by the advertisers that appear on the website, based on your interaction with the advertisements or advertisers.
© 2007-2024 - Fusion Media Limited. All Rights Reserved.