SUMMARY SINCE LAST FOMC
Inflation Data
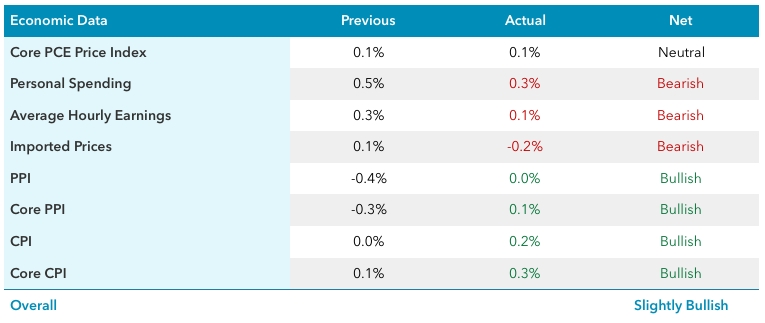
Overall inflation data saw a slight improvement since the last FOMC meeting, mainly contributed by the CPI and PPI data. Core PCE Price Index, which is one of the most important inflation data that the Fed is watching, remains the same as previous month. Personal Spending and Average Hourly Earnings saw a dip from previous month. These data might still support a rate hike in September.
Employment Data
Though employment data did not show any improvement, with a dip in the Non-farm Employment Change, we need to acknowledge that with an unemployment rate of 4.9%, it is already in full employment. The focus wouldn’t be very much on employment data, but more towards inflation and overall economic activities.
Economic Activity
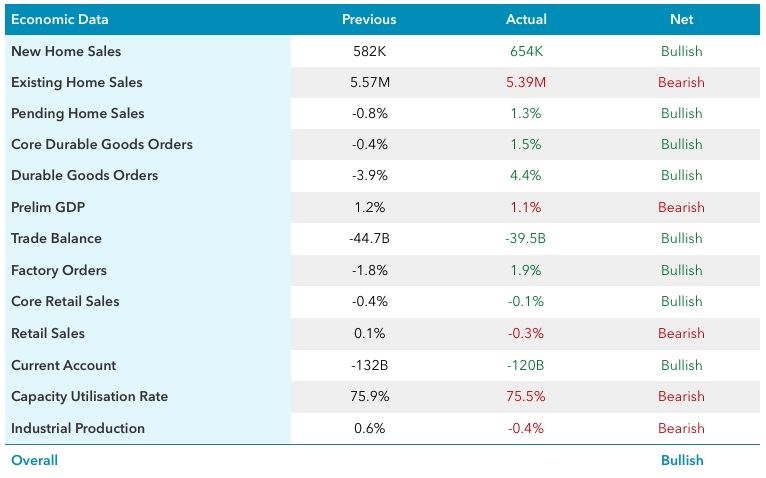
Economic activity saw a relative improvement as compared to the previous month. Data from Home Sales, Factory and Goods Orders were the main contributors to this improvement. Retail Sales is still in the negative, and might present some concerns in the overall US economy as this economic indicator gives the earliest and broadest look at vital consumer spending data, which in turn leads to inflation and overall economic growth as well. In all, the economic activity data might still support a rate hike in September.
Economic Sentiment
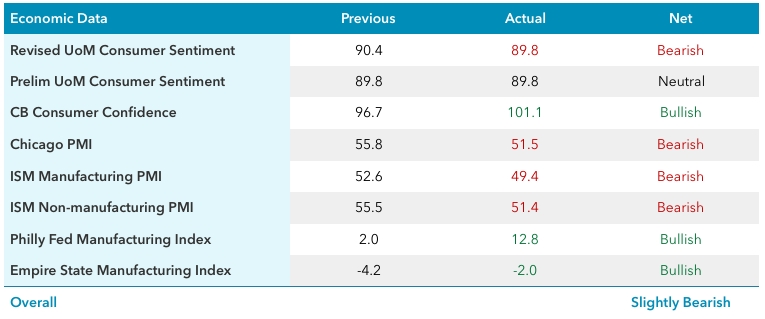
Economic sentiment remains relatively weak both from the consumers’ and manufacturers’ perspective. The only significant improvement comes from CB Consumer Confidence and Philly Fed Manufacturing Index. On the other hand, the fall in ISM Manufacturing PMI below 50.0 indicates that most of the manufacturing purchasing managers are expecting a more negative economic direction. As leading indicators of the economic health, these data might have the Fed wanting to wait for more confirmation before raising rates.
8 MAJOR ECONOMIES PERFORMANCE
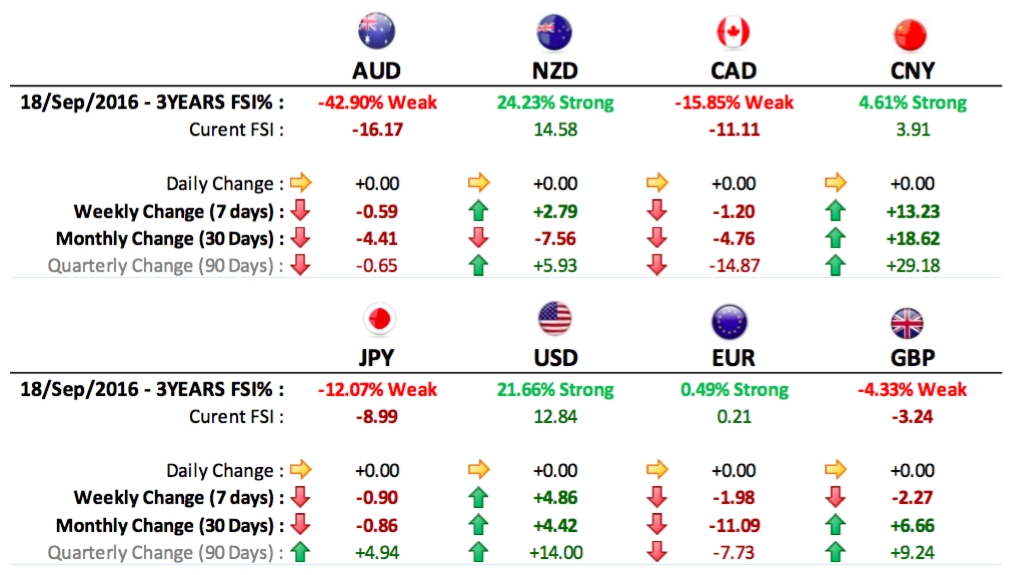
Looking at the other major global economies –
The best currencies to trade against the US dollar in view of a rate hike in September would be:
The best currencies to trade against the US dollar in view of NOT having a rate hike in September would be:
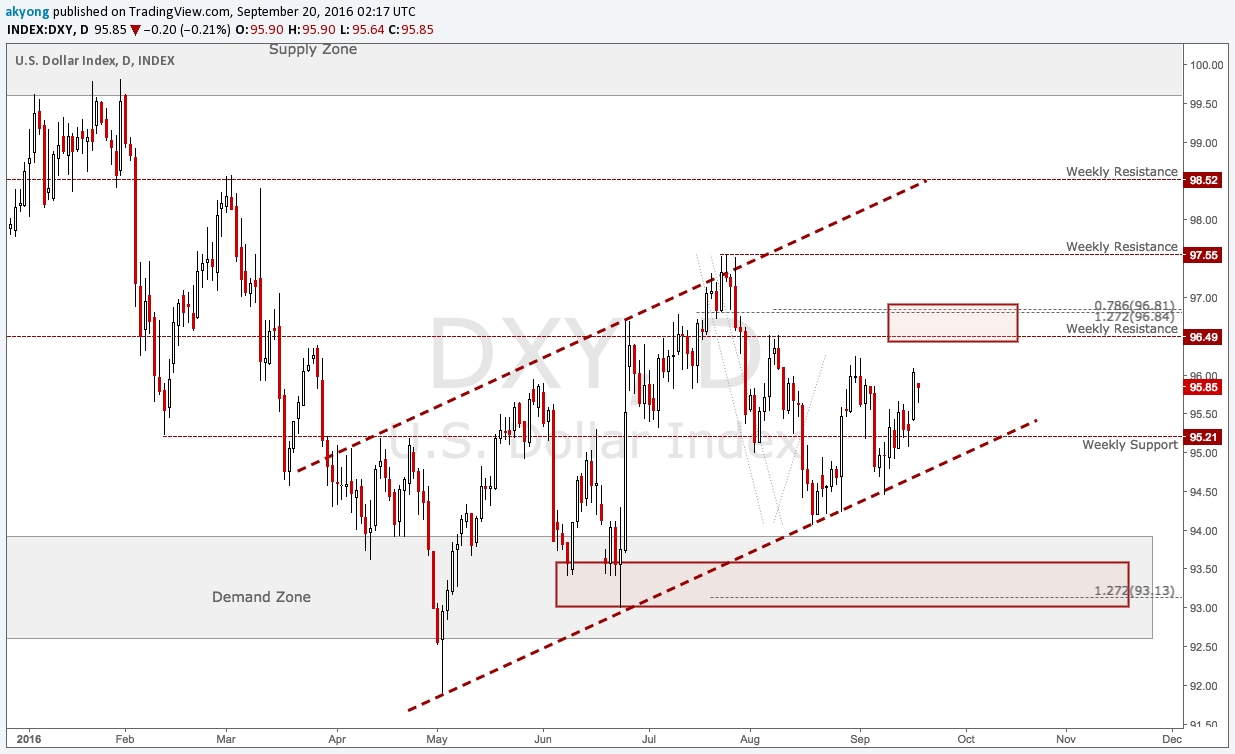
The Dollar Index (DXY) is currently respecting the uptrend channel nicely since May 2016.
Resistance levels are at –
- 96.49
- 97.55
- 98.52
Support level is at –
- 95.21
Key areas of interest for trade opportunities:
- 96.84 for a potential short trade
- 93.13 for a potential long trade
EUR/USD
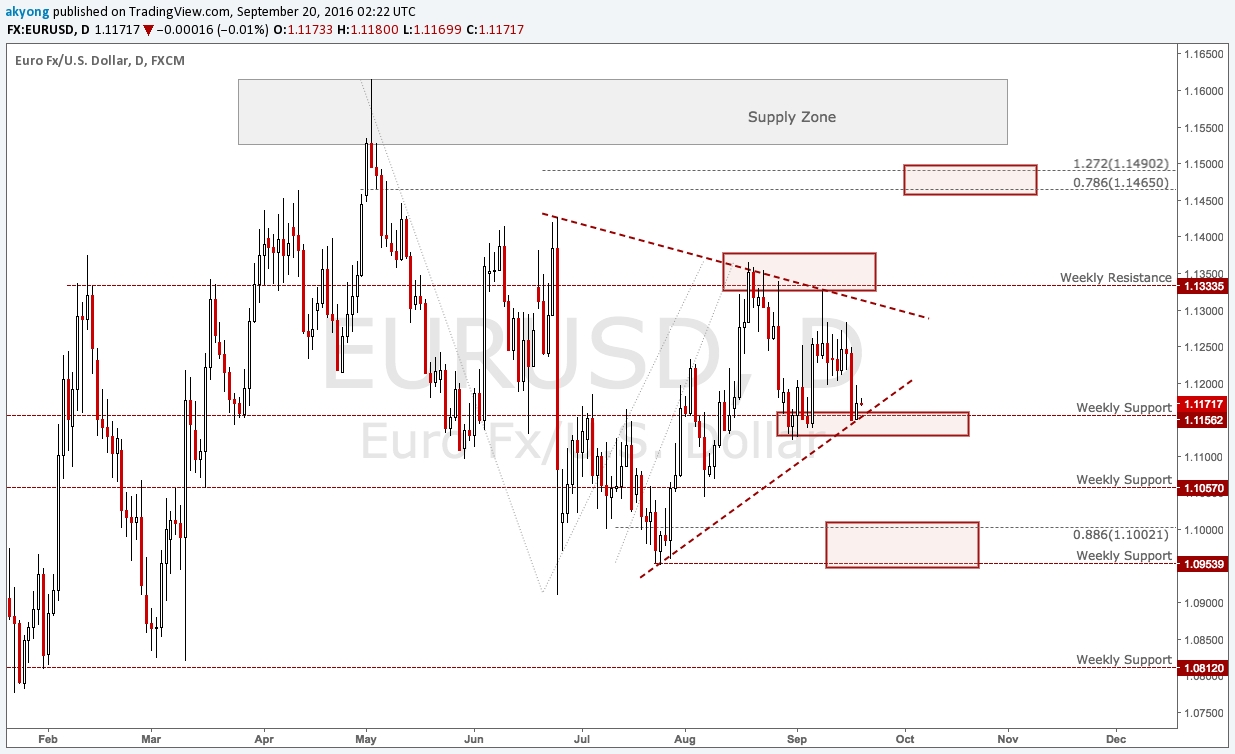
The EUR/USD is currently trading between 1.1156 and 1.1333, with a triangle consolidation pattern.
Resistance levels are at –
- 1.1333
- 1.1465
Support level is at –
- 1.1156
- 1.1057
- 1.0954
Key areas of interest for trade opportunities:
- 1.1490 for a potential short trade
- 1.1002 for a potential long trade
USD/JPY
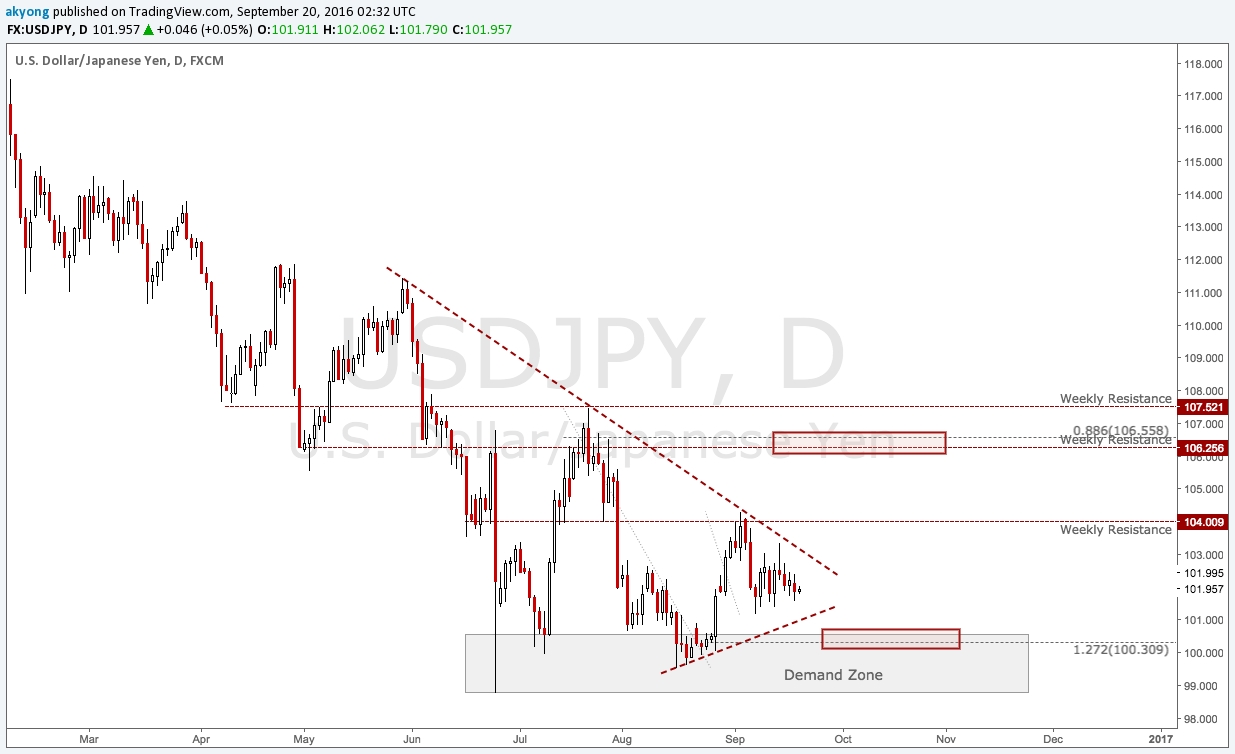
Very similar to EUR/USD, the USD/JPY is also currently in a consolidation within a triangle pattern.
Resistance levels are at –
- 104.00
- 106.25
- 107.52
Support level is at –
- 100.30
Key areas of interest for trade opportunities:
- 106.55 for a potential short trade
- 100.30 for a potential long trade
AUD/USD
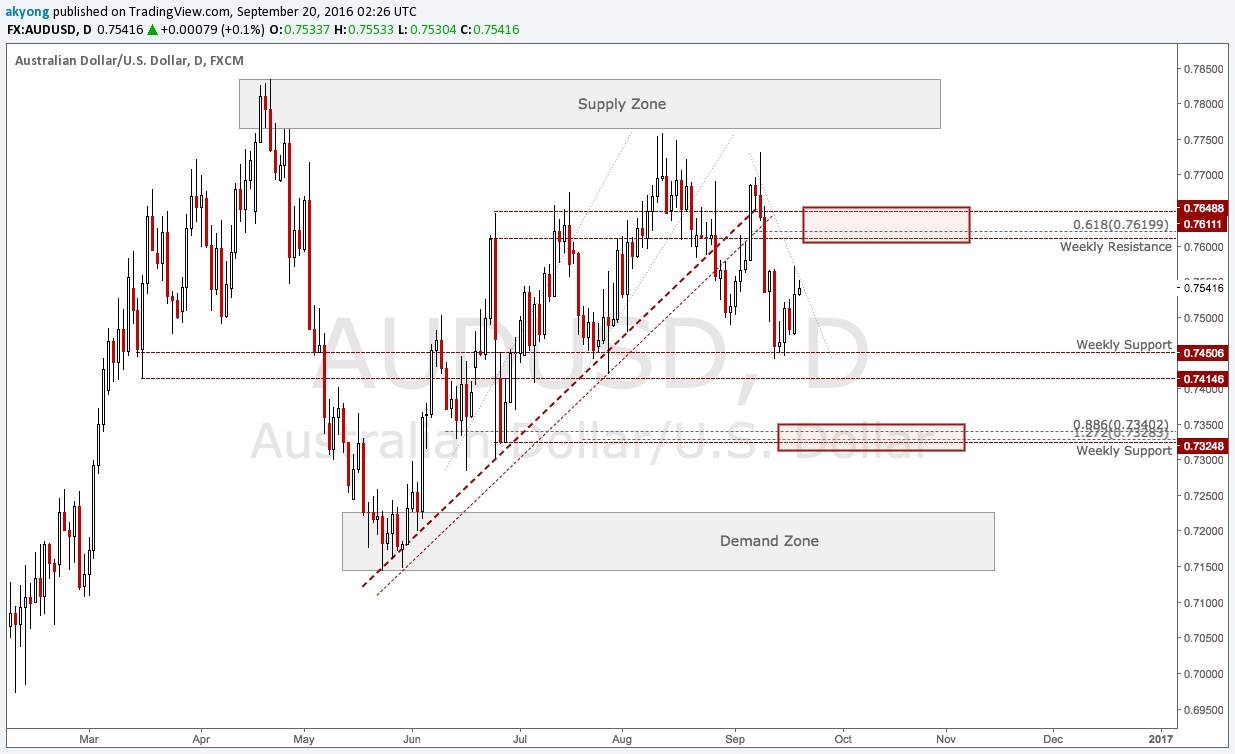
Price recently broke the uptrend and is starting to show signs of a new bearish momentum.
Resistance levels are at –
- 0.7648
Support level is at –
- 0.7414
- 0.7324
Key areas of interest for trade opportunities:
- 0.7620 for a potential short trade
- 0.7328 for a potential long trade
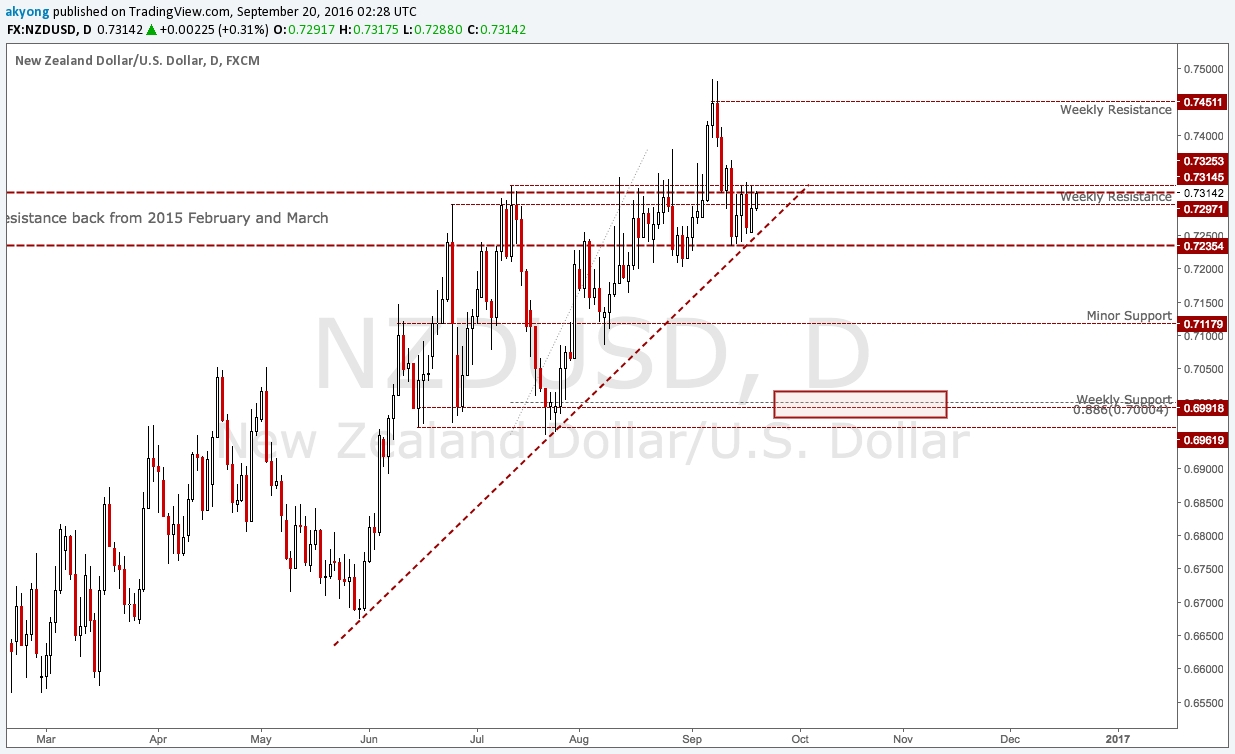
NZD/USD
Price is still respecting the uptrend since June 2016 and has recently broke above the major resistance formed back in February and March 2015.
Resistance levels are at –
- 0.7325
- 0.7451
Support level is at –
- 0.7118
- 0.6991
Key areas of interest for trade opportunities:
- 0.7000 for a potential long trade
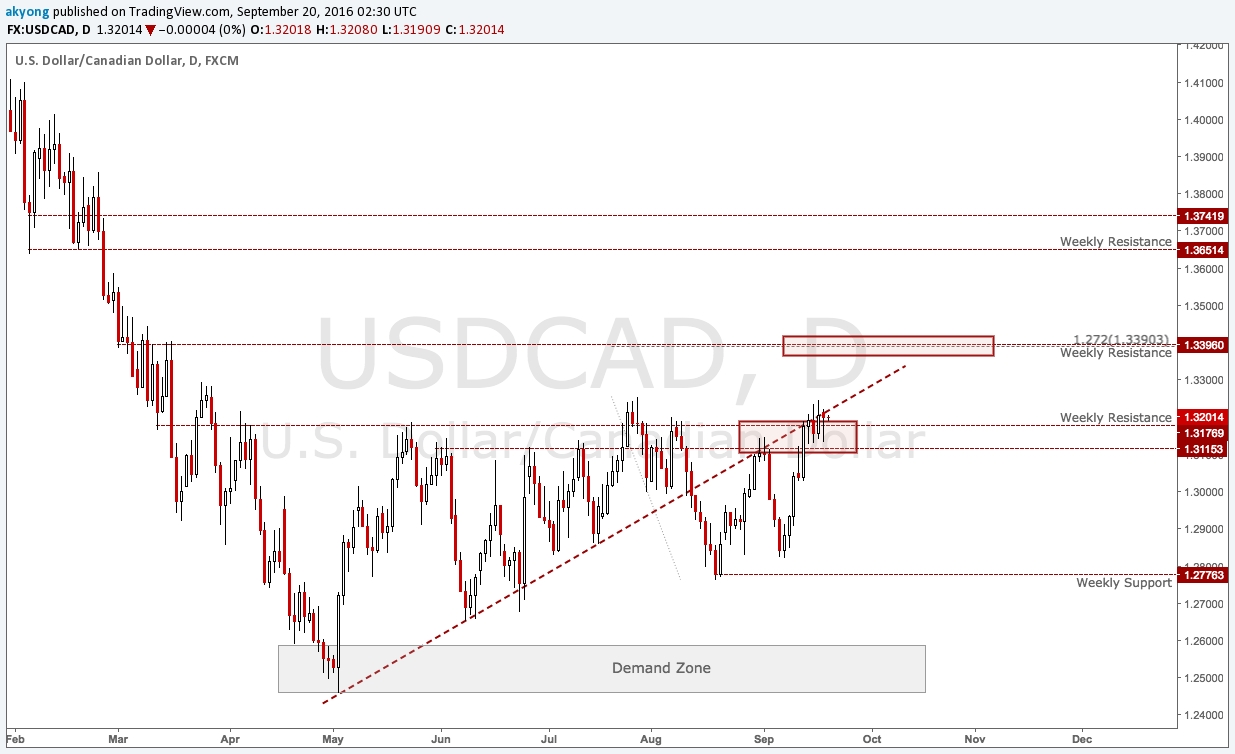
USD/CAD
Price broke out of the triangle pattern but has since retraced back to the previous resistance level.
Resistance levels are at –
- 1.3396
- 1.3651
- 1.3742
Support level is at –
- 1.2776
Key areas of interest for trade opportunities:
- 1.3390 for a potential short trade

