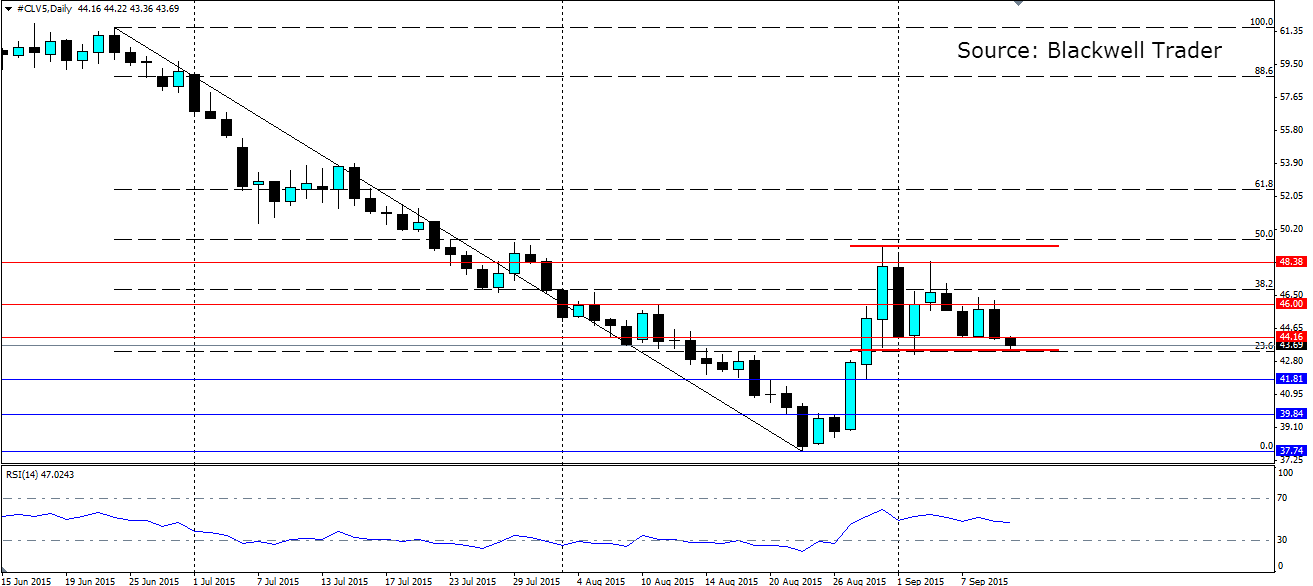
The Oil market has quietened down recently after the solid moves seen at the end of last month. It has subsequently found a range, but the fundamentals haven’t changed, so will it last?
Oil has found solid support along the bottom of the range around the $43.50 a barrel level, with several rejections higher off it. The range extends as high as $49.30 a barrel, however each subsequent high has been getting lower. The weakness is coming on the back of usual supply and demand concerns.
On the demand side, China is the real worry. PPI fell by -5.9% y/y, which largely reflects the fall in commodity prices over the course of the year. Chinese trade figures earlier this week are a real concern for the global economy. Chinese exports are down -5.5% from a year ago, but this was overshadowed by the -13.8% y/y fall in imports. This is a real concern as it indicates that domestic demand has slowed considerably, and industrial production is likely to show a similar trend.
On the Supply side, the API crude inventory figures showed another solid build in reserves. The American Petroleum Institute report showed 2.1m barrels of crude were added to the stockpiles. Watch for the official figures from the DoE due today, along with the weekly rig count. The market is expecting another build in the official figures, and anything close to the API number will see crude take another tumble.
Another factor to consider is the upcoming refineries stand down, coming later this month. Refiners schedule maintenance for September and October as they transition to winter-grade fuel from summer-grade fuels. As refineries demand less crude and while production continues, stockpiles will grow which will put pressure on prices. U.S. refineries enter planned seasonal alterations as the federal government requires different mixtures in the summer and winter to minimize environmental damage.

A neutral RSI leaves plenty of room for a downside push out of the range. If the range fails, we can expect a large number of stop losses to be triggered, which will add to the pressure of the breakout. Oil is currently sitting just above the 23.6% Fib line which forms support at $43.50 a barrel. If we see a break lower out of the range, there is little in the way of support between here and the recent lows at $37.74. Perhaps look for minor support at $41.81 and $39.84.
The Fundamentals point to a weaker oil price over the months ahead, which suggests the range will eventually fail. If it holds in the short term, look for resistance to be found at $44.16, $46.00 and $48.38 with the top of the range also acting as firm resistance.
