The S&P 500 struggled to gain price traction between the tail end of 2014 and the beginning of November in 2016. For many folks, the period represented 22 taxing months of uncertainty.
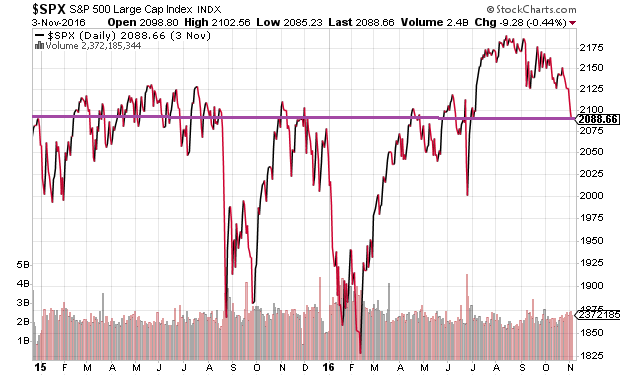
Then came Trump. Suddenly, the investing community began soaking up the potential that corporate tax cuts, infrastructure spending and regulatory reform might revive a slow-growing economy. U.S. stocks rocketed to set records. In contrast, bond prices plummeted, as yields for the safer haven securities soared.
Since the beginning of 2017, however, bond investors have been showing that they are less convinced that the federal government can deliver on business-friendly promises. How can one tell? A flatter Treasury bond yield curve.
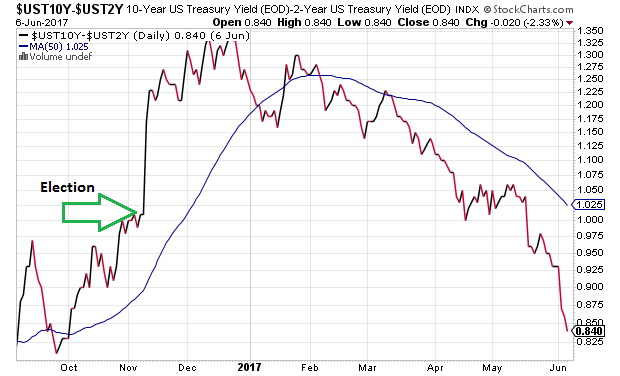
After the November election, the spread between shorter term 2-year Treasury bond yields and longer-term 10-year Treasury bond yields rose dramatically above 1% (100 basis points). Today? Back down to 0.84%.
In spite of the queasiness expressed by bond believers, stocks have been hitting record highs on bad news and good news alike. In particular, if an economic data point is strong, speculators exclaim that corporations will be more profitable. If the economic data are weak, then speculators fall back on the notion that the Federal Reserve will always abstain from meaningful rate hikes; similarly, global central banks will increase or at least maintain their bloated balance sheets in perpetuity. Good news? Bad news? Everything comes up rosy for stocks.
For whatever reason or reasons, however, the bond market does not believe the stock market. Since March, the 10-year Treasury yield has fallen from 2.6% all the way down to 2.17%. That is lower than it was right after the November election. The 10-year has even dipped below a critical trendline (200-day moving average).
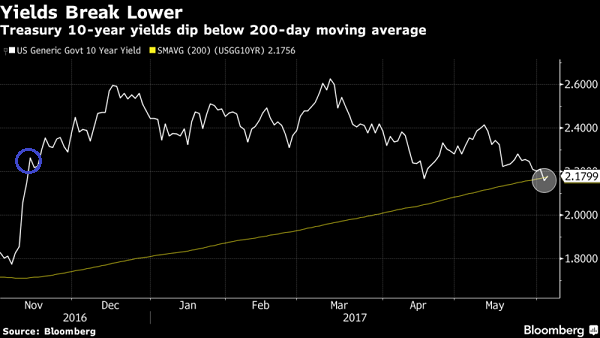
So who is right? The “Nervous Nellies” buying low-yielding government bonds or the “Smug Sammies” buying Netflix (NASDAQ:NFLX) at any share price?
For the moment… both. There are very few asset classes that haven’t been gaining ground in 2017. Stocks, bonds, real estate, precious metals – all of them are currently serving a purpose in providing total return to owners.
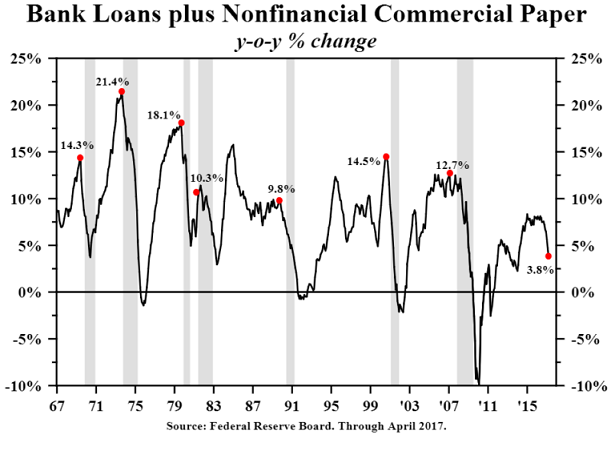
That said, there are a number of less favorable signs for excessive risk takers in the stock market. For instance, there has been a dramatic decline in bank lending. Year-over-year growth is poor across commercial/industrial (business) loans as well as consumer loans. Keep in mind, the extension of credit has been at the center of the recovery from the Great Recession, and now the borrowing appears to be drying up.
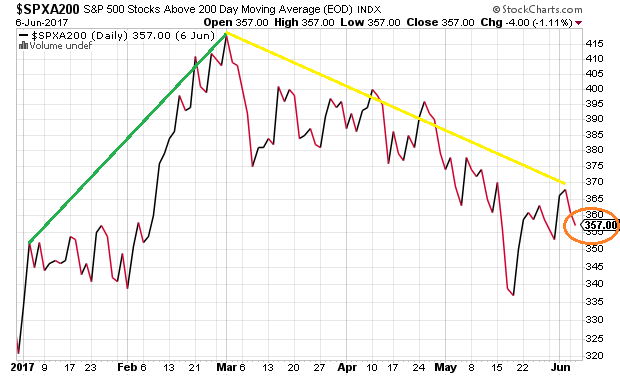
Another indication that disproportionate risk-taking in stocks may be a bad idea is the nature of the rally itself. Since peaking in March, the number of S&P 500 companies in a long-term uptrend (i.e., above a 200-day moving average) continues to fall. In truth, a large percentage of the large-cap price gains emanate exclusively from a handful of tech giants like Facebook (NASDAQ:FB), Apple (NASDAQ:AAPL), Amazon (NASDAQ:AMZN) Netflix (NASDAQ:NFLX) and Google/Alphabet (NASDAQ:GOOG).
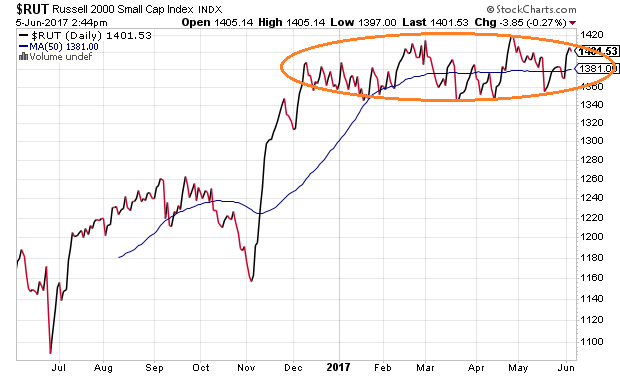
What’s more, smaller companies have not been participating in earnest since December. The Russell 2000 Index that had catapulted higher after the election has traded sideways for the better part of six months. In other words, smaller company stocks have been doubting whether or not consequential tax cuts will occur, in much the same way that the bond market has been skeptical.
Part of the bond market’s misgivings about stock market glee? In addition to the pullback in year-over-year bank lending? The uptick in commercial bankruptcies.
.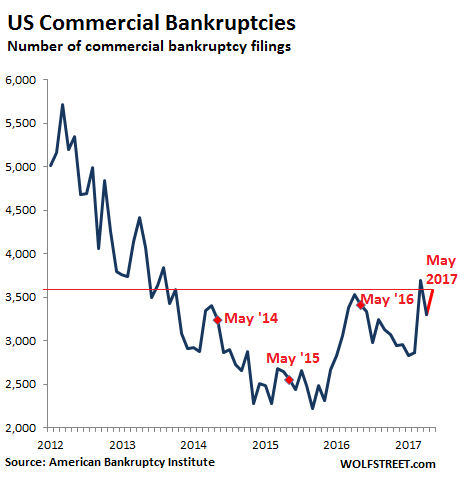
Many dismiss the data as indicative of an unfortunate turn of events for over-leveraged energy companies in 2015 and 2016; they also disregard the more recent buckling of brick-n-mortar retailers as an unimportant footnote in the Amazonian story of online consumption.
However, disregarding bankruptcy filings as inconsequential ignores the possibility that credit conditions are not quite as loose as they were coming out of the Great Recession. Debt refinancing may be more difficult than it was five years earlier, as evidenced by the slowdown in bank lending discussed earlier. It follows that if the nine-year credit cycle expansion is downshifting, riskier stock assets may depreciate and prompt lenders to become even more restrained.
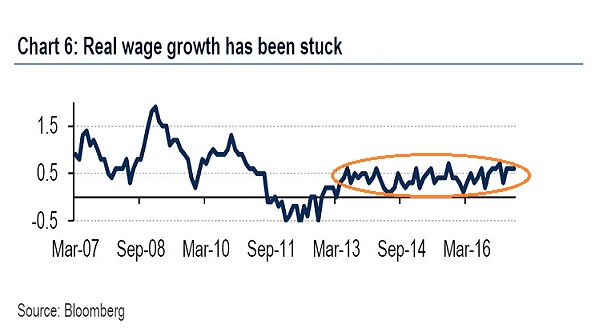
The lower borrowing costs certainly help to keep real estate mortgages in check, pushing property prices higher where inventory is particularly scarce. Then again, if credit is less free-flowing and if inflation-adjusted wage growth remains stagnant, how can those who have not made into it the top quintile of earners trade up from smaller homes or buy for the first time? Might there be a reason why home ownership rates (63%) are stuck in the mid-1960s?
Recently, a commenter chastised me for reducing risk for the bulk of my moderate growth-and-income clients when the Federal Reserve settled its last asset purchase (QE3) on December 18, 2014. I moved from a more traditional 70% growth (stock) / 30% income (bond) allocation to 50% growth / 25% income / 25% cash equivalents.
The performance difference in the allocation shift thus far? Using Vanguard Total Stock Market (NYSE:VTI), iShares Corporate Bond (NYSE:LQD) and Guggenheim Enhanced Short Duration (NYSE:GSY)? 4%. Meanwhile, the risk-adjusted performance returns for 50/25/25 versus 70/30 in the time frame are negligible.
Not surprisingly, there are many who do not care about standard deviations, Sharpe ratios, beta or alpha. For them, reward is reward regardless of the risk being taken. In contrast, my 30 years of success involves reducing risk when prices are higher and people are complacent, confident and/or greedy. In that manner, I am able to take greater risks when prices are lower and people are panicky.
Disclosure Statement: ETF Expert is a web log (“blog”) that makes the world of ETFs easier to understand. Gary Gordon, MS, CFP is the president of Pacific Park Financial, Inc., a Registered Investment Adviser with the SEC. Gary Gordon, Pacific Park Financial, Inc., and/or its clients may hold positions in the ETFs, mutual funds, and/or any investment asset mentioned above. The commentary does not constitute individualized investment advice. The opinions offered herein are not personalized recommendations to buy, sell or hold securities. At times, issuers of exchange-traded products compensate Pacific Park Financial, Inc. or its subsidiaries for advertising at the ETF Expert website. ETF Expert content is created independently of any advertising relationship.
