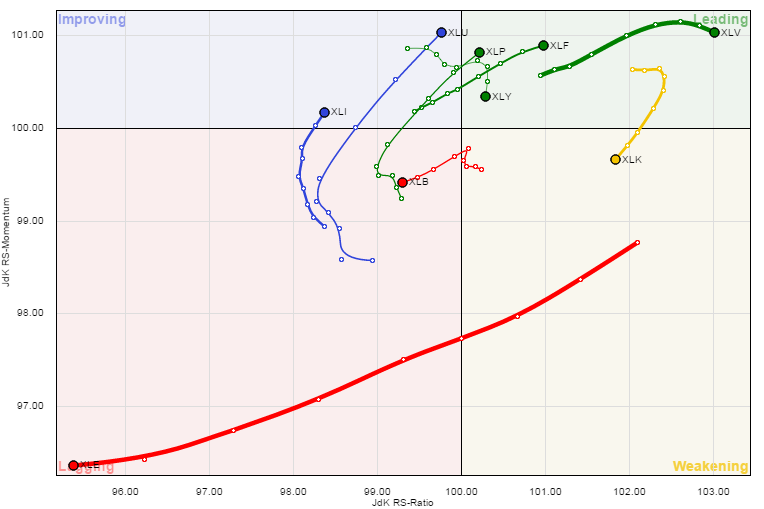
With the increase in volatility over the last several weeks, I think it’s time to check back in on sector relative performance. While the U.S. equity market as a whole has gotten rocked since it’s August/September high, understanding what the underlying sectors are doing and what’s leading can be a great tool to stay in control. Over the last 30 days, the S&P 500 has lost 3.5% of its value, Utilities (SPDR Select Sector - Utilities (NYSE:XLU)) and Consumer Staples (SPDR - Consumer Staples (ARCA:XLP)) are actually positive and the Energy sector (SPDR Energy Select Sector Fund (ARCA:XLE)) is down over 10%. While the S&P 500 (SPDR S&P 500 (ARCA:SPY)) often garners the most attention, we can’t lose focus of the nine S&P sectors that make up the index.
Health Care (SPDR - Health Care (ARCA:XLV)) has been a consistent leader this year, spending the bulk of the last 30 weeks in the ‘Leading’ category of the Relative Rotation Graph (shown below). The Relative Rotation Graph (RRG) plots the sectors using their the trend of their relative performance against the S&P 500 as well as the momentum of that trend. Historically the sectors have moved in a clockwise fashion as they go in and out of favor relative to the index and as the momentum of their relative performance rises and falls as well.
About three weeks ago we saw that the Technology sector (SPDR Select Sector - Technology (NYSE:XLK)) began to turn lower but remained in the ‘Leading’ category. Since then, and over the last several weeks, this once leading area of the market has shifted into the ‘Weakening’ category throttled by the decline in the momentum of its relative performance.
It’s also important to note the strength out of Financials (Financial Select Sector SPDR Fund (ARCA:XLF)), and Consumer Staples. In a post on September 29th I highlighted the ratio between XLP and the S&P 500, which was seeing a bullish divergence in momentum and ultimately led to the defensive sector outpacing the market for the last several weeks. Energy (SPDR Energy Select Sector Fund (ARCA:XLE)) has continued to sink deeper into the depths of the ‘Lagging’ category with the momentum of its under-performance intensifying.
2014 has seen the theme of defensive strength with Utilities, Health Care, and Consumer Staples, leading the way for the bulk of the year. This likely worries equity bulls as traders steer away from the higher beta components in favor of the perceived safer sectors.
Disclaimer: Do not construe anything written in this post or this blog in its entirety as a recommendation, research, or an offer to buy or sell any securities. Everything in this post is meant for educational and entertainment purposes only. I or my affiliates may hold positions in securities mentioned in the blog. Please see my Disclosure page for full disclaimer.

