Last week in my Weekly Technical Market Outlook I discussed multiple divergences that were concerning me. Apparently I was not the only one as traders took stocks down 1.37% for the S&P 500 (SPX). However, after Thursday’s close we had quite a few signs of mean-reversion flipping bullish. We saw a bounce on Friday and I’ll be watching to see if stocks continue to rise this week or if the divergences that are still in place keep buyers from pulling their triggers. With just two days left for the month, we sit with the S&P down roughly 1% for September, Small Caps (iShares Russell 2000 Index (ARCA:IWM)) are off 4.41%, and International stocks (EFA) are down 2.91%.
Trend
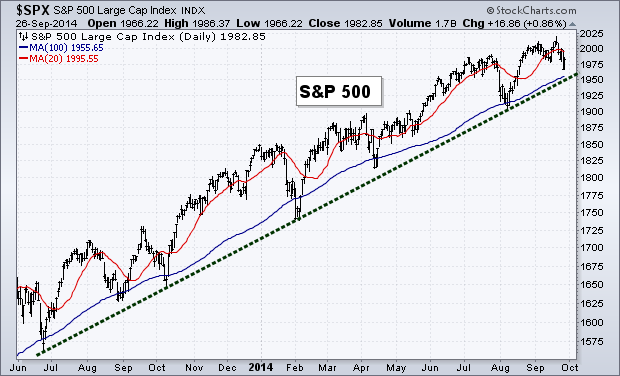
As stocks fell last week we saw the S&P get close to testing its long-term trend line and 100-day Moving Average. Since neither of these measures were broken and we have yet to see a lower low, the trend remains positive.
Breadth
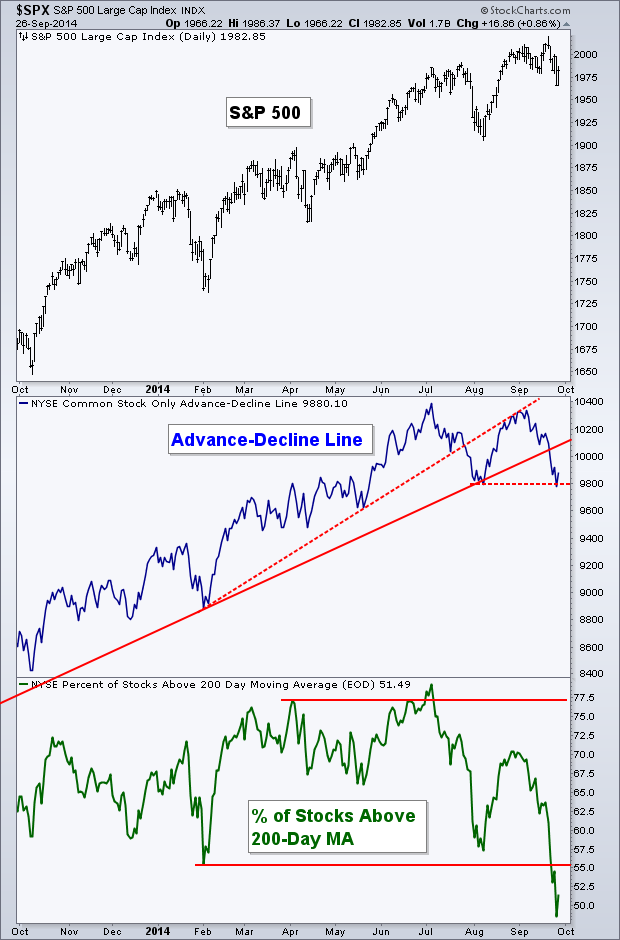
We almost saw a lower low in the Common Stock-Only Advance-Decline Line, but the bounce on Friday keep things in an up trend. We now have a defined range of support and resistance: the August low and the September/July high. With last week’s selling we saw more stocks break below their 200-day Moving Averages as shown by the indicator in the bottom panel of the chart.
Consumer Staples
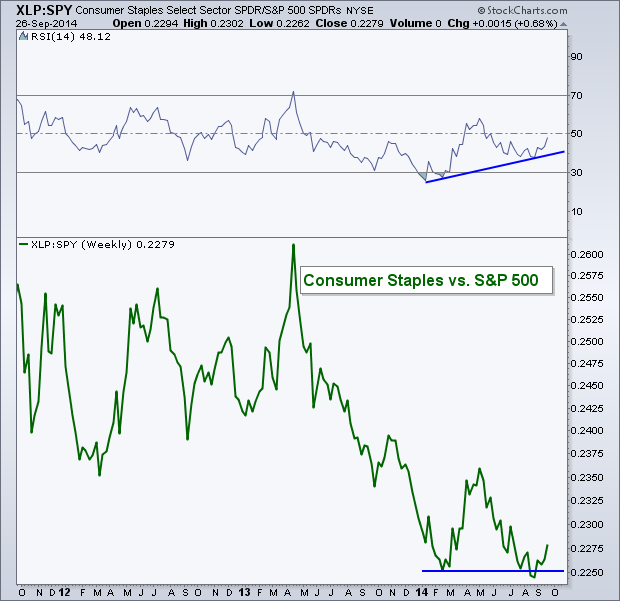
In last week’s Technical Market Outlook I showed the Relative Rotation Graph for the nine S&P sectors. The Consumer Staples (XLP) sector has been in the ‘lagging’ quadrant of the graph for the last eight weeks. But it has been rising for the last four as momentum of the relative performance trend has strengthened.
Below is a weekly chart of the ratio between XLP and the S&P 500 (SPY). It appears the recent strength in XLP has created a false breakdown of the prior February low for the ratio. This false break also has occurred with the Relative Strength Index (RSI) creating a higher low, which produces a bullish divergence. I’ll be watching to see if XLP can continue to gain ground.
When looking at the seasonal strength for the Consumer Staples sector, October has been the fourth strongest month over the last five years, up 75% of the time.
October Seasonality
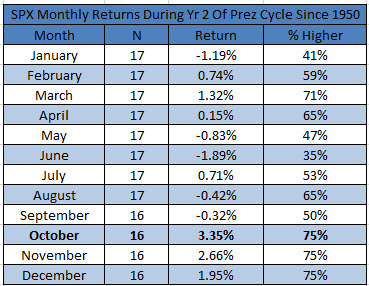
My friend Ryan Detrick, CMT is constantly producing top-notch tables and charts on Twitter and his blog. Over the weekend Ryan discussed a few points regarding October seasonality. When looking at the 2nd year of the Presidential Cycle since 1950, Ryan noted that October has been the strongest month of the year. While I acknowledge that 16 occurrences is not a robust sample size, it’s still an interesting stat to point out. Will this October follow its historical trend?
Here is Ryan’s table showing the monthly breakdown:
Momentum
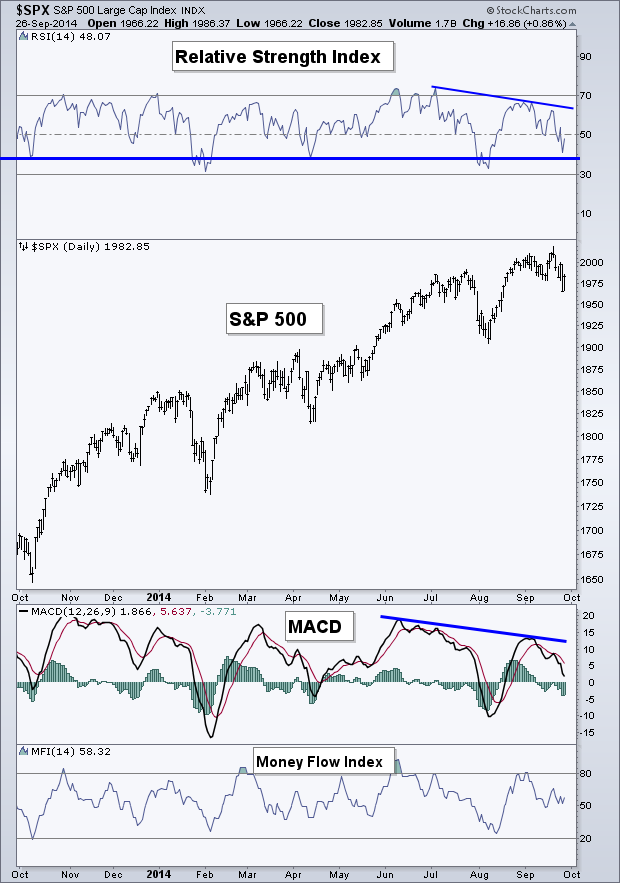
Not much has changed for the Momentum chart from last week. While price weakened, the Relative Strength Index remained above its previous level of support. Both the RSI and the MACD remain in a bearish divergence with price, something bulls know they must fix in order to see another new high.
U.S. Dollar
The dollar rose 1.05% last week and is up almost 9% from its May low. It’s interesting to note that the US Dollar has been up for 11 weeks in a row! While the currency has been on a tear over the last several months, traders do not appear to have let up off the gas based on the latest COT data. The chart below comes from Eric Burroughs and shows the Speculator net-position which is at its highest level ever.
Burroughs also noted that when you take into account Open Interest with respect of the net-position that it’s not at a record high but is nearly two standard deviations above its mean.
60 Minute S&P 500
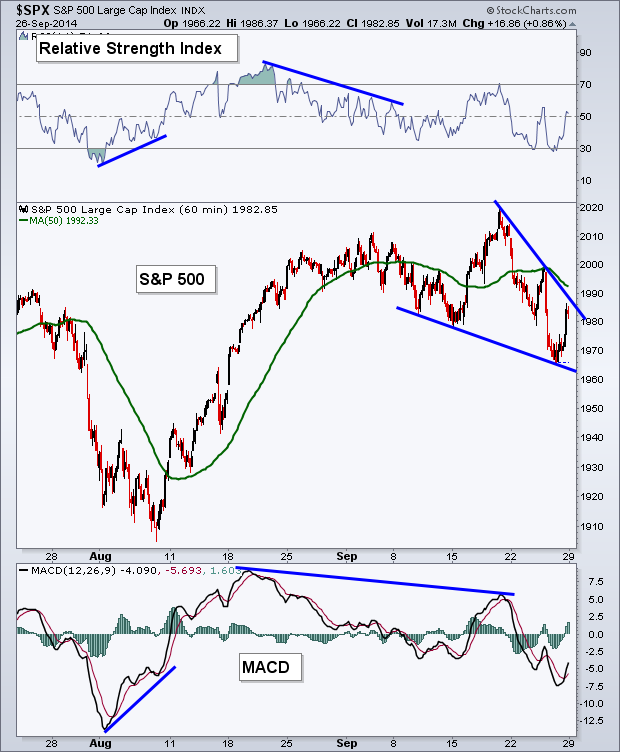
The intraday chart for the S&P shows that price found support at the trend line connecting the series of lower lows for September. We’ve yet to see price break its series of lower highs and remains under its 50-1 hour Moving Average.
Last Week’s Sector Performance
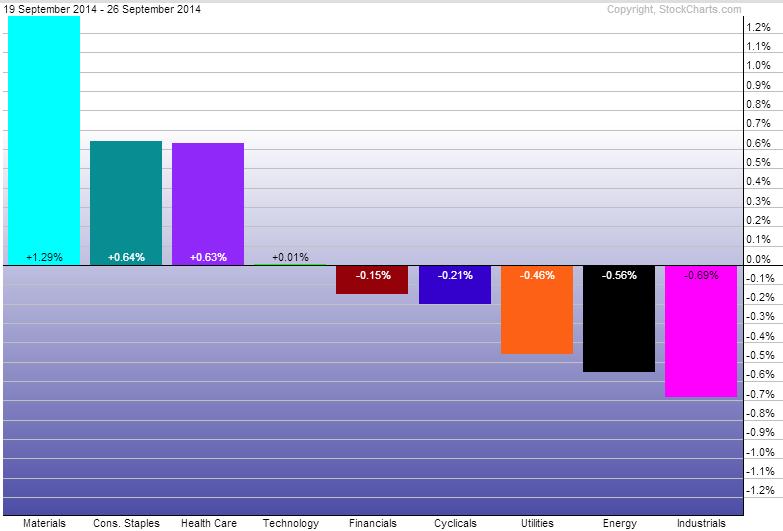
Last week we saw the Materials sector (SPDR Materials Select Sector (ARCA:XLB)) take the top spot in relative performance against the S&P. Consumer Staples (SPDR - Consumer Staples (ARCA:XLP)) and Health Care (SPDR - Health Care (ARCA:XLV)) were the second and third best performers, respectively. The Industrial (Industrial Sector SPDR Trust (ARCA:XLI)), Energy (SPDR Energy Select Sector Fund (ARCA:XLE)), and Utility (SPDR Select Sector - Utilities (NYSE:XLU)) were the worst performing sectors for the week.
Year-to-Date Sector Performance
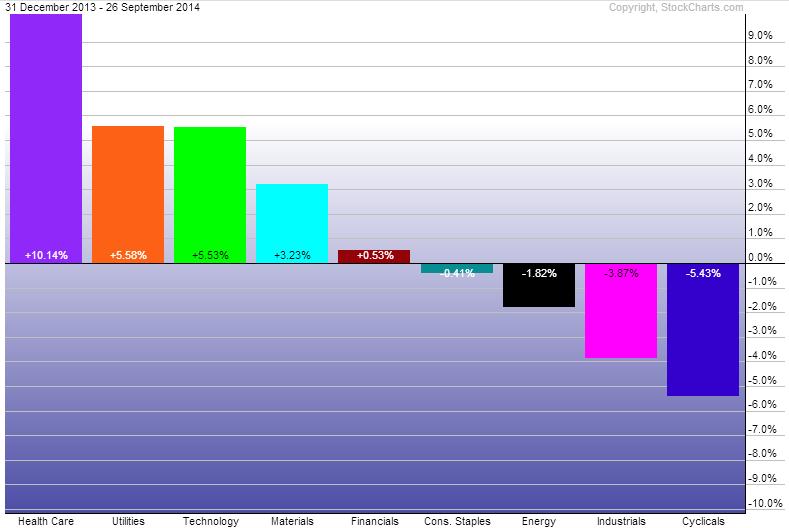
Health Care, Utilities, Technology (SPDR Select Sector - Technology (NYSE:XLK)) remain the strongest sectors for 2014. Consumer Discretionary (SPDR Consumer Discr. Select Sector (ARCA:XLY)) and Industrials have been the weakest sectors YTD.
Disclaimer: Do not construe anything written in this post or this blog in its entirety as a recommendation, research, or an offer to buy or sell any securities. Everything in this post is meant for educational and entertainment purposes only. I or my affiliates may hold positions in securities mentioned in the blog. Please see my Disclosure page for full disclaimer.

