This past week, the market was treated by relatively good industrial production data from the Federal Reserve. Headline seasonally adjusted Industrial Production (IP) increased 0.7 % month-over-month but was still contracting 1.1 % year-over-year. The question for today - is this the beginning of recovery of industrial production - or just a flash in the pan?
Follow up:
Recoveries begin when the night is darkest. Industrial production has been decelerating over one year - and the current situation is continuing to be compared with very bad data from either the previous month or the year prior. At some point deceleration ends, and recovery begins - even though the year-over-year data is in contraction.
Industrial Production headline index has three parts - manufacturing, mining and utilities - manufacturing was up 0.3 % this month (up 0.4 % year-over-year), mining down 2.3 % (down 13.4 % year-over-year), and utilities were up 5.8 % (up 0.4 % year-over-year). Note that utilities are 10.8 % of the industrial production index, whilst mining is also 10.8 %.
Comparing Seasonally Adjusted Year-over-Year Change of the Industrial Production Index (blue line) with Components Manufacturing (red line), Utilities (green line), and Mining (orange line)

In reality, the manufacturing component of industrial production has not contracted (in any significant amount) - and has simply bounced along the zero growth line. Industrial production is contracting because of mining - which is not caused by economic cycles but environmental reasons.
Year-over-Year Change Total Industrial Production - Unadjusted (blue line) and the Unadjusted 3 month rolling average (red line)

Economic downturns have been signaled by only watching the manufacturing portion of Industrial Production. Historically manufacturing year-over-year growth has been negative when a recession is imminent. This index is nearing the warning area for a recession - but close is significant with horseshoes and hand grenades, not economic analysis.
Seasonally Adjusted Manufacturing Index of Industrial Production - Year-over-Year Growth

The improvement his month cannot be considered significant when one looks at the year-over-year growth on the above graphic.
Readers know I am not a great fan of surveys - but the manufacturing surveys for April were predicting a relatively positive manufacturing growth.
Comparing Surveys to Hard Data:

In the above graphic, hard data is the long bars, and surveys are the short bars. Industrial Production manufacturing subindex is the long blue lines. The arrows on the left side are the key to growth or contraction.
So is industrial production April uptick a flash-in-the-pan? My guess is that the USA is at or nearly at the bottom of long term deceleration in manufacturing. Because mining is included in Industrial Production, we may have more downward movement until Industrial Production recession ends.
Other Economic News this Week:
The Econintersect Economic Index for May 2016 marginally dropped into contraction. The index is at the lowest value since the end of the Great Recession. Is this a recession warning? This index is not designed to guess GDP - or the four horsemen used by the NBER to identify recessions (industrial production, business sales, employment and personal income). It is designed to look at the economy at main street level. A general concern is that current data is being compared against relatively soft historical data - both month-over-month and year-over-year. The current data should be showing more comparative strength. At this point in time - I believe it is possible, but not probable, that a USA recession is either underway or will soon occur. The data which comprises elements of GDP are VERY weak but not yet recessionary - and there is little in the data yet to suggest a further drop in trends. Most major GDP elements are flat (the rate of growth is not changing), or there is a slight upward bias in the trend lines.
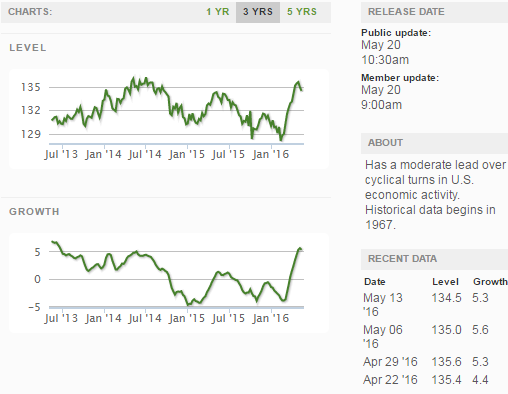
Economic Cycle Research Institute (ECRI) Weekly Leading Index (WLI) Growth Index is now in positive territory and forecasting a marginally strengthening economy six months from now.
Current ECRI WLI Growth Index
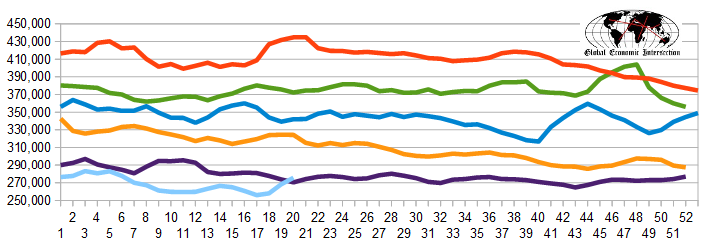
The market expectations for weekly initial unemployment claims (from Bloomberg) were 263,000 to 275,000 (consensus 267,000), and the Department of Labor reported 294,000 new claims. The more important (because of the volatility in the weekly reported claims and seasonality errors in adjusting the data) 4 week moving average moved from 258,000 (reported last week as 258,000) to 268,250. The rolling averages generally have been equal to or under 300,000 since August 2014.
Weekly Initial Unemployment Claims - 4 Week Average - Seasonally Adjusted - 2011 (red line), 2012 (green line), 2013 (blue line), 2014 (orange line), 2015 (violet line)
Bankruptcies this Week: Breitburn Energy Partners, Midstates Petroleum Company, Dex Media, SandRidge Energy, Constellation Enterprises, Code Rebel
Click here to view the scorecard table below with active hyperlinks
Weekly Economic Release Scorecard:
