There is special interest in 2nd quarter earnings both as a read on the economy and trends in costs and margins. Ordinarily the focus would be Fed Chair Yellen’s House testimony on Wednesday and the reprise on Thursday. She has stated her viewpoint so frequently – rate hike possible, data dependent, expecting better growth – that a surprise is unlikely.
I expect the earnings story to steal Yellen’s thunder, with pundits wondering:
Will Falling Earnings Sink the Stock Market?
Prior Theme Recap
In my last WTWA I predicted a lazy summer week, with plenty of time for pundits to analyze the heavy schedule of FedSpeak. If you merely looked at the overall result for the week, it might seem like this call was accurate. Wrong! The Greek story lingered with both downs and ups. China’s market collapsed and the government intervened. Computer malfunctions took down the NYSE.
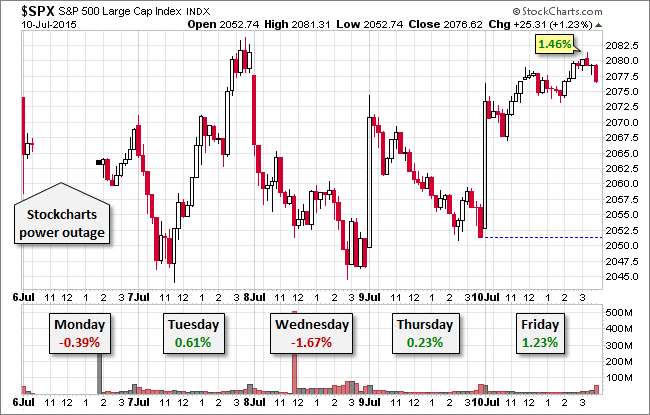
As usual, Doug Short’s excellent five-day summary captures the story in one great chart. Read the full article for more charts and discussion.
I did say that guessing last week’s theme was a crapshoot. At least I was right about that!
So why bother thinking about a theme? We would all like to know the direction of the market in advance. Good luck with that! Second best is planning what to look for and how to react. That is the purpose of considering possible themes for the week ahead. You can try it at home.
This Week’s Theme
Let me start with the theme competition. A focal point for this week will be Fed Chair Yellen’s semi-annual Congressional testimony. This time she starts with the House Financial Services Committee and repeats the same message the next day before the Senate Banking Committee. Six months from now the order will be reversed. Both groups get a chance to ask questions. If you know why it is done this way, it will take you far in your understanding of Congress as an institution, and American politics in general.
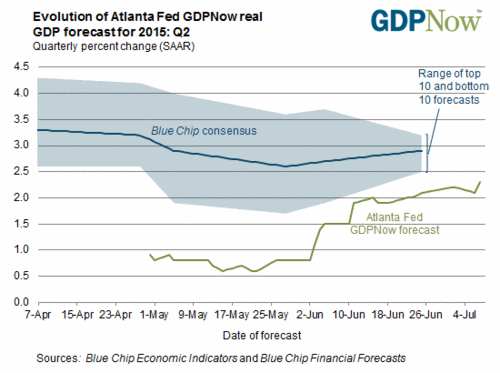
While we will have live coverage for most of this, do not expect anything new. You can save a lot of time by reading the latest update from Fed expert Tim Duy. This is a great economic summary combining helpful charts and understandable explanations. This summary and chart provide a small taste of the article:
The US economy is an island of mediocre tranquility in the midst of the stormy sea of the global economy. Tranquil enough to keep the Fed eyeing its first rate hike despite the surrounding storm, but sufficiently mediocre that they feel no reason to rush into that hike. As such, the Fed will remain on the sidelines until the forecast points toward sunnier skies. Uncertainty from Greece and China are likely raising the bar on the domestic conditions that would justify a rate hike.
Despite the Fed story, I expect earnings news to steal the spotlight. There is considerable focus on year-over-year comparisons showing an expected decline in earnings. The importance of earnings is one of the few aspects of stock evaluation that garners nearly universal agreement. Because of this significance concern about the economy, I expect the question:
Will Falling Earnings Sink the Stock Market?
The Viewpoints
The earnings story is controversial including a range of viewpoints. We need to consider both aspects of this week’s question – the possible earnings decline and the effect on the stock market.
Earnings declines
- A weak economy has finally taken a toll on corporate profits, especially in some sectors
- A strong dollar hurts the exports and profit margins of many large companies
- Profit margins are extended and overdue for a reversion to normal levels
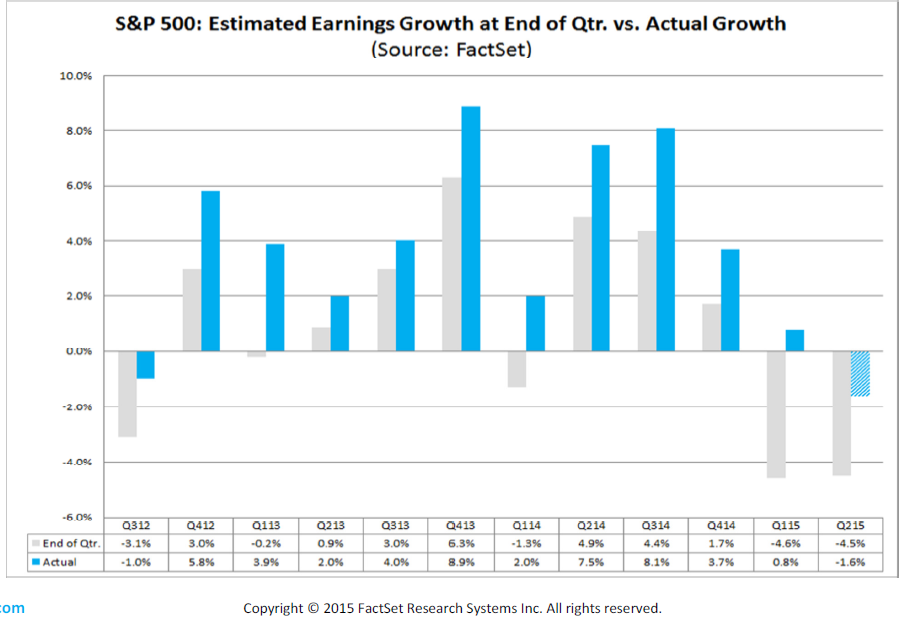
There is excellent and objective overall coverage on these topics from FactSet, including the overall expectation of a 4.4% YoY decline in earnings. FactSet expects higher margins, but lower revenue growth until 2016.
Impact on stocks
Reality will finally take down the market
Stocks will pause while earnings “catch up”
Forward earnings are less worrisome, especially without energy
Comparisons for the rest of 2015 will be easier
There is excellent and objective commentary on forward earnings and the implications for stocks from Brian Gilmartin.
As always, I have my own ideas in today’s conclusion. But first, let us do our regular update of the last week’s news and data. Readers, especially those new to this series, will benefit from reading the background information.
Last Week’s Data
Each week I break down events into good and bad. Often there is “ugly” and on rare occasion something really good. My working definition of “good” has two components:
- The news is market-friendly. Our personal policy preferences are not relevant for this test. And especially – no politics.
- It is better than expectations.
The Good
There was some good economic news.
- Alcoa (NYSE:AA) earnings reflected economic strength. Mostly this was in the revenue figures, highlighted in interviews on CNBC. Although I have no position in Alcoa, and it has lost its “bellwether” status, it is still a good read on certain markets – autos, aircraft, and construction of certain types. Seeking Alpha’s excellent transcript reports are essential tools for those who want to monitor companies, but cannot spend hours on conference calls.
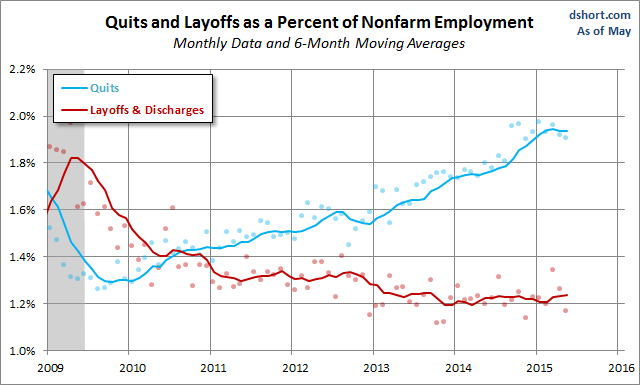
- Job turnover is encouraging, as documented in the JOLTs report. The most important features of this report are not overall job growth (tracked better by payroll employment) but the job openings and quit rate. These show the flexibility in the market, as well as the willingness to leave a job on a voluntary basis. Doug Short has a complete analysis as well as this chart, which is a conservative take on the quit rate.
- ISM services were “in line” but signaling a solid expansion. Scott Grannis explains why. Both for the Eurozone and the US, the service economies remain in moderate expansion.
- Rail traffic was a bit better this week. See the report at GEI.
- Fed commentary was generally dovish, despite Yellen’s Friday speech. See the discussion above citing Tim Duy.
The Bad
There was also some negative data last week, partly on the policy front.
- No convincing progress on Greece. We started the week with the resounding “no” vote in the Greek referendum. This seemed to give extra bargaining power to Prime Minister Tsipras. The initial market reaction to the uncertain effects of a Grexit was very negative. Later in the week, news about the umpteenth plan for a resolution seemed to stabilize markets. By the time markets open, who knows? We do not seem to be much closer to an enduring solution. Read The New Athenian and The FT for updates.
- Negative earnings revisions outnumber the positive shifts by 4-1. (FactSet).
- Commodity prices moved sharply lower. I am reporting this as a negative, but I am skeptical because of possible distortions from Chinese margin calls. (Stock investors forced to cash in commodity positions). That is fine as an indicator of commodity prices, but not as an economic signal. Bespoke also reports on some upward pressure. The jury is out on this indicator.
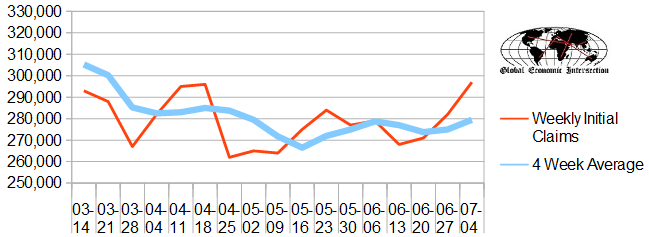
- Initial jobless claims were worse than expected. It is a difficult time of year for seasonal adjustments, making it a good time to check in with Steven Hansen at GEI. His report takes various approaches, including non-seasonal comparisons. Here is one of the helpful charts:
The Ugly
Technology and “glitches.” The United Airlines delay was aggravating and possibly costly for passengers. The trading halt at the NYSE did not prevent people from trading at other sites, but (combined with the United problem) raised questions about a possible cyber-attack. The WSJ site went down, perhaps because of visitors checking on the NYSE story. Some may have altered their trades in the face of uncertainty and a market decline. And finally, there were calls from Congress to investigate and act if necessary.
Meanwhile, how is the government doing with technology? The Office of Personnel Management finally admitted the extent of the information breach and the slowness of the response. The FBI admitted that the background check system should have prevented the Charleston shooter from buying a gun. Congress is calling for an investigation into this tragic failure.
Technological oversight and regulation might not be the strong suit for government.
The Silver Bullet
I occasionally give the Silver Bullet award to someone who takes up an unpopular or thankless cause, doing the real work to demonstrate the facts. Think of The Lone Ranger.
No award this week. Nominations welcome, especially if refuting a specific chart that is both bogus and popular!
Quant Corner
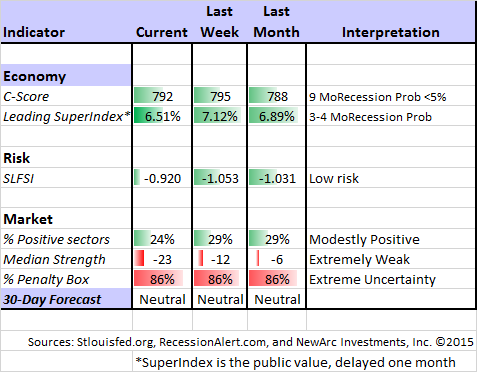
Whether a trader or an investor, you need to understand risk. I monitor many quantitative reports and highlight the best methods in this weekly update. For more information on each source, check here.
Recent Expert Commentary on Recession Odds and Market Trends
Doug Short: An update of the regular ECRI analysis with a good history, commentary, detailed analysis and charts. If you are still listening to the ECRI (almost four years after their recession call), you should be reading this carefully. Recently the ECRI finally admitted to the error in their forecast, but still claims the best overall record. This is simply not true. I rejected their approach in real time during 2011 and also highlighted competing methods that were stronger. Until we know what is inside the black box (I suspect excessive reliance on commodity prices and insistence on unrevised data) we will be unable to evaluate their approach. Doug is more sympathetic in his last update. While I disagree, it will require a longer post to elaborate.
Bob Dieli does a monthly update (subscription required) after the employment report and also a monthly overview analysis. He follows many concurrent indicators to supplement our featured “C Score.”
RecessionAlert: A variety of strong quantitative indicators for both economic and market analysis. While we feature the recession analysis, Dwaine also has a number of interesting systems. These include approaches helpful in both economic and market timing. He has been very accurate in helping people to stay on the right side of the market.
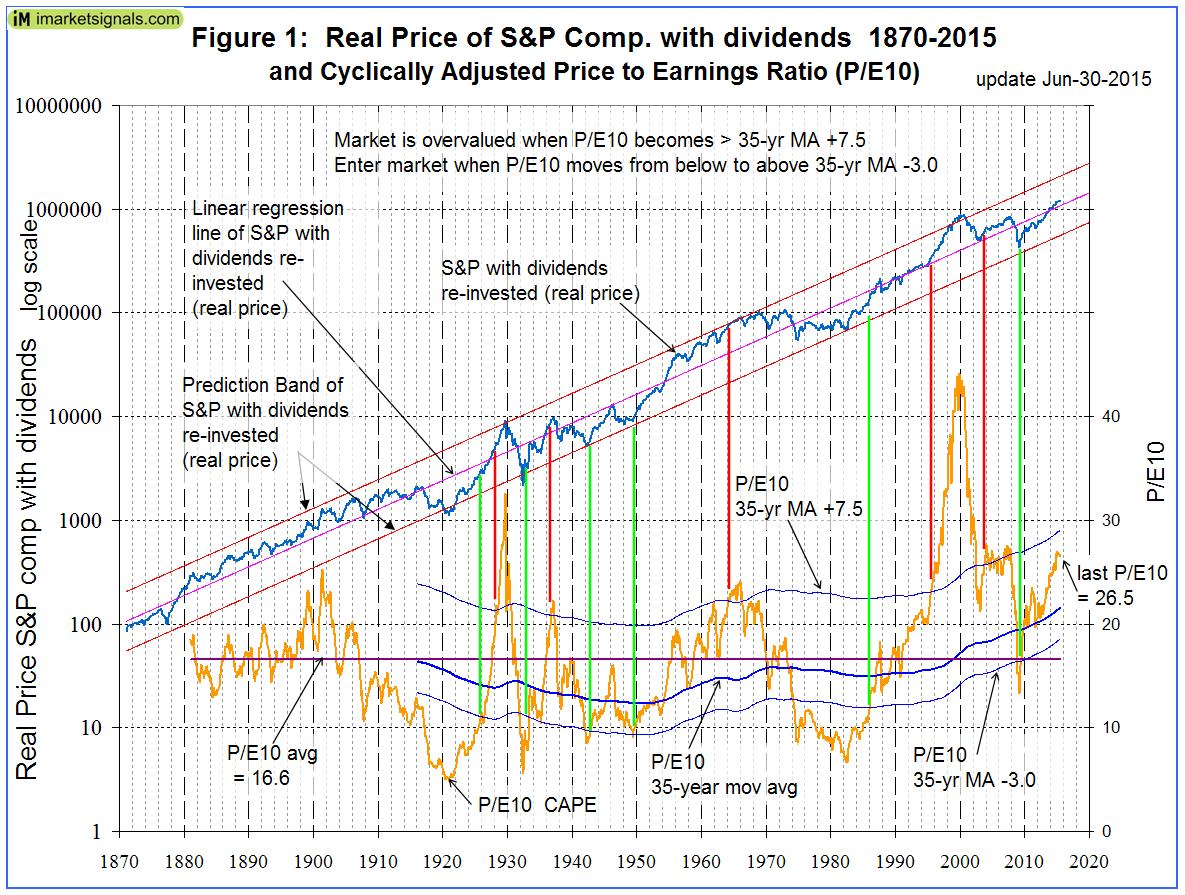
Georg Vrba: An array of interesting systems. Check out his site for the full story. We especially like his unemployment rate recession indicator, confirming that there is no recession signal. He gets a similar result from the Business Cycle Indicator. Georg continues to develop new tools for market analysis and timing, including a combination of models to do gradual shifting to and from the S&P 500.
This week Georg has an improvement of the Shiller P/E CAPE ratio method. Unlike the widely-followed Shiller method, Georg’s approach has the advantage of actually generating some “buy” signals! (And as I have frequently noted, I am a fan of Prof. Shiller, who owns stocks and advises others to do the same). Current readings show that stocks are “not greatly overvalued, nor likely to crash anytime soon.”
New Deal Democrat, in addition to his must-read, high frequency indicators, has produced a midyear update on four crucial long leading indicators – those used by Prof. Geoffrey Moore, founder of ECRI. I believe that the ECRI performance would have been better had they stayed with these methods.
See the full post for charts and discussion of each, but here is the conclusion:
While not every long leading indicator is making new highs, and in particular corporate profits have stalled, the other indicators solidly suggest that this economic expansion will last at least through the 2nd quarter of 2016.
The Week Ahead
This week brings some important economic data.
The “A List” includes the following:
- Housing starts and building permits (F). Is the rebound for real?
- Michigan sentiment (F). Good concurrent read on employment and spending.
- Retail sales (T). What happened to the gasoline savings?
- Initial jobless claims (Th). The best concurrent news on employment trends, with emphasis on job losses.
- Industrial production (W). Volatile series, but helpful in GDP estimates.
The “B List” includes the following:
- PPI (W). Inflation data remains of little interest until and unless we see a few hot months.
- CPI (F). See PPI.
- Beige book (W). Anecdotal information for the next FOMC meeting.
- Crude oil inventories (W). Current interest in energy keeps this on the list of items to watch.
- Wholesale Inventories (F). May data relevant to GDP.
As usual, I have little interest in the regional Fed surveys. There is plenty of FedSpeak in addition to Chair Yellen’s Congressional appearances. Expect further news from Greece and China, but both are hard to game.
Options expiration may add some volatility, especially if overall trading volume remains low, or we get a big move early in the week.
How to Use the Weekly Data Updates
In the WTWA series I try to share what I am thinking as I prepare for the coming week. I write each post as if I were speaking directly to one of my clients. Each client is different, so I have five different programs ranging from very conservative bond ladders to very aggressive trading programs. It is not a “one size fits all” approach.
To get the maximum benefit from my updates you need to have a self-assessment of your objectives. Are you most interested in preserving wealth? Or like most of us, do you still need to create wealth? How much risk is right for your temperament and circumstances?
My weekly insights often suggest a different course of action depending upon your objectives and time frames. They also accurately describe what I am doing in the programs I manage.
Insight for Traders
Felix continued a neutral stance for the three-week market forecast, but it is verging on turning mildly bearish. The confidence in the forecast remains very low with the continuing extremely high percentage of sectors in the penalty box. Despite the overall market verdict Felix has been mostly invested in three top sectors. For part of the week this included a ½ size position (leaving trading accounts 67% long) in some inverse fund hedges. For more information, I have posted a further description — Meet Felix and Oscar. You can sign up for Felix’s weekly ratings updates via email to etf at newarc dot com. Felix appears almost every day at Scutify (follow him here).
Dr. Brett Steenbarger has another powerful and authoritative article helpful both to traders, and also to nearly everyone else. He shows how a simple technique – keeping a journal – can greatly improve your performance. You need to read the full article to see how and why this works. It is not enough just to write.
…journals of the least successful participants served reporting and venting functions. That is, the least successful professionals used their journals to report on events of the day or week and to express their thoughts and feelings about those events.
Conversely, the journals of the most successful money managers served learning functions. The journal entries specifically analyzed what had happened in the recent past, but then went further to frame goals for going forward.
Insight for Investors
I review the themes here each week and refresh when needed. For investors, as we would expect, the key ideas may stay on the list longer than the updates for traders. Major market declines occur after business cycle peaks, sparked by severely declining earnings. Our methods are focused on limiting this risk. Start with our Tips for Individual Investors and follow the links.
We also have a page summarizing many of the current investor fears. If you read something scary, this is a good place to do some fact checking.
In Part Two of my series on risk I used the Chinese market as an example of headline risk. My main objective is to explain how to navigate the ever-threatening headlines. Along the way I share a few ideas of how you might profit from stocks with Chinese exposure.
Other Advice
Here is our collection of great investor advice for this week.
If I had to pick a single most important article, it would be Sarah Max’s cover story in Barron’s, Bye-Bye Bond Funds. The article is loaded with great advice, especially for the average investor. How do you reduce the volatility of a stock portfolio, when bonds have become risky? Here are some key points:
- Quoting Robert Johnson, CEO of the American College of Financial Services — “If you lock in bonds at these levels, you’re locking in a purchasing-power loss.”
Not long ago, the notion of a no-bond portfolio would have seemed crazy. But what’s really crazy, says Johnson and many of his peers, is clinging to the conventional wisdom. “What are bonds supposed to do? They’re supposed to preserve wealth, provide periodic cash flow, and hopefully some price appreciation,” he says. At the moment, however, they aren’t offering much in the way of income, and there is a real possibility that investors could lose money.
- Investors should consider individual bonds rather than bond funds. You can choose to hold a bond to maturity. The fund manager may not, or may not have a choice in the face of redemptions.
That exit may be already starting. In the first five months of the year, investors put more than $75 billion into taxable and municipal-bond funds, according to Lipper. But in June, the trend turned, with investors withdrawing a net $17 billion. If that presages a bigger exit, bond funds could fall sharply.
- Asset allocation is an individual matter
There was a time when bonds could do it all—provide stability, income, and capital appreciation. Those days are over. Now, investors need to pick their focus. And that focus should be determined by an investor’s need, rather than a hackneyed asset-allocation plan that decrees 55-year-olds dump 55% of their assets into bonds.
But even if the conventional wisdom no longer holds true, the advice is very much the same as it ever was: Know thyself as an investor, and construct a plan that suits your timeline and temperament.
This article and the companion pieces are well worth the price of this week’s issue. We do all of this for clients, but some readers may be able to take these important steps for themselves.
Stock Ideas
Energy is ready to rebound according to the investment newsletter writers with the best records on oil prices (via Mark Hulbert). The article includes both technical and fundamental reasons and suggests several undervalued stocks in the sector.
I am a fan of Bret Jensen, following his research reports. He takes a value approach and is willing to be a contrarian. This week he happened to write about two stocks we already hold, Gilead (NASDAQ:GILD) which has done well and iRobot (NASDAQ:IRBT) which has not. His rationale is quite similar to ours. Readers would benefit from following his future work.
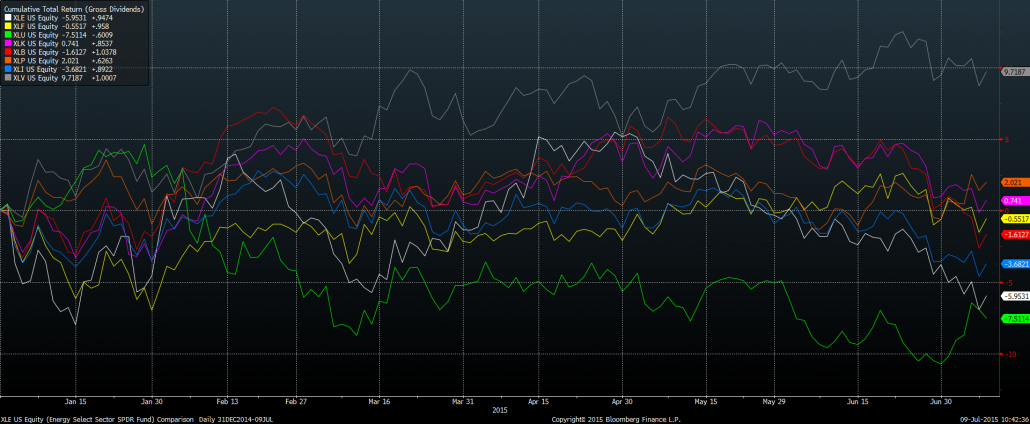
Alpha Architect analyzes the performance of the most attractive sectors on a value basis for the first two quarters of 2015. Health care did great, while energy was the worst. The payoff from value investing does not always show up in six months.
Personal Finance
Professional investors and traders have been making Abnormal Returns a daily stop for over ten years. The average investor should make time (even if not able to read every day as I do) for a weekly trip on Wednesday. Tadas always has first-rate links for investors in this special edition. As always, there are several great links, but I especially liked this story about retirement calculators.
Value versus Momentum
There are many successful investment approaches. In the WTWA posts we usually describe momentum as a trading approach, normally as practiced by our “Felix” model. Value investing is what we do in our long-term stock program. Ben Carlson has a nice explanation of the difference, including some data. Here is an important takeaway:
As with any strategy that has been proven to work historically, there are usually two explanations given — either the strategy takes more risk and is compensated for those risks or there are behavioral factors involved that allow the premium to persist. To me, the behavioral explanation always makes more sense, because really the only way for one investor to outperform is for another investor to underperform. To do better you have to be able to take advantage of someone else’s mistakes. This is the foundation that any viable long-term investment strategy rests on.
Market Outlook
Ben Carlson, providing a little calm in a volatile week, contributed a helpful and humorous post on who would benefit from a market correction. Example: Everyone who’s been saying volatility is a “second half story.” And: That co-worker of yours who told you in 2012 that they were going to wait for a 10% correction until they put their 401(k) contributions back into the market.
Final Thought
If you are a realist, you should expect this to be a tough quarter for earnings comparisons. Most of the factors cited in the introduction were indeed headwinds.
And the market paused.
We are left with the question of whether we are at an inflection point for earnings and for stocks. While I understand the current caution, I remain optimistic for the long term for the following reasons:
- There is no recession on the horizon. This is the biggest threat to stocks.
- The Q1 economic weakness was (for various reasons) overstated on GDP.
- The currency issues are stabilizing, and can be mitigated with appropriate stock choices.
- Stock buybacks improve per-share earnings. (Unlike others, I do not mind getting a bigger piece of a smaller pie).
- P/E multiples improve when investors have more confidence in the future. That is coming.
- As usual, the estimate reductions have probably set the bar too low. Here are the past results from FactSet;
Stocks in the sectors I have recommended showed solid gains in a soft market in the first half of 2015. I am looking for more of the same as well as a generalized rally.
This said, it might take another quarter of earnings results to convince the naysayers.
Patience is a virtue – and often necessary for investors!
Correction
Last Week’s WTWA stated that Greek debt was equivalent to 30 hours of Walmart (NYSE:WMT) revenue. The source I quoted accurately described this as the debt to the IMF, the potential default, not the total national debt. I always try to be completely accurate, and I regret this misstatement.

