This week’s economic calendar is loaded with all of the most important data. In addition, Super Tuesday might provide a defining event to the political campaign. Oil remains volatile, and Fed Speakers are on the loose. Despite the political stories, I expect the punditry to be asking:
Can the strengthening U.S. economy support the rebound in stocks?
Prior Theme Recap
In my last WTWA (two weeks ago) I predicted a focus on the biggest market worries. That guess was not very successful, since the market immediately began a nice, two-week rally. The list of topics was still good preparation, since stories quickly turned to “what could derail the rally?” As Doug Short notes, Friday’s market did not respond even when “an avalanche of economic data surprised to the upside”. Once again, a modest decline in oil prices accompanied a modest decline in stocks. You can see the story in Doug Short’s weekly chart. (With the ever-increasing effects from foreign markets, you should also add Doug’s World Markets Weekend Update to your reading list).
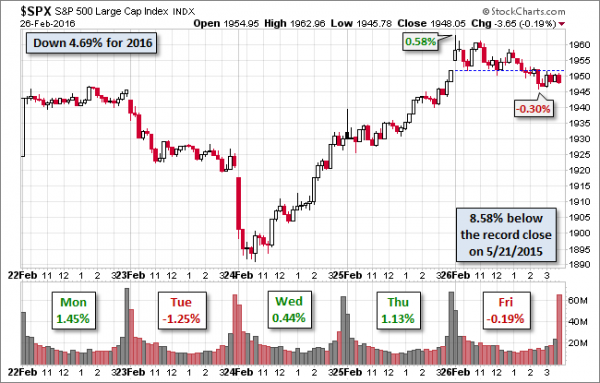
Doug’s update also provides multi-year context. See his full post for more excellent charts and analysis.
We would all like to know the direction of the market in advance. Good luck with that! Second best is planning what to look for and how to react. That is the purpose of considering possible themes for the week ahead. You can make your own predictions in the comments.
This Week’s Theme
Earnings season continues, and the political stories will be dominant, at least through Tuesday’s elections and Wednesday morning’s news. In a non-political season, this week would be all about the economy. We have more of the important reports squeezed into a single week (helped by Leap Year?) than we have seen in many months.
Recent economic news suggests improvement, at least in the U.S. At some point, a better economy will lead to better earnings and more support for stock prices. By the end of the week I expect politics to be a sideshow with focus on the economic data. Market observers and pundits will be asking:
Can economic improvement provide a foundation for equity markets?
Background
- Doug Short’s observations about Friday’s trading highlight the ambivalent response to “good news.”
- Q1 GDP is tracking higher, as much as 2.5% according to the Atlanta Fed’s GDP now reports. (James Picerno looks at this source and others).
- Are first quarters a “one off” over the last few years? Brian Gilmartin writes:
Has anyone else noticed how volatile the first quarter has been the last 3 years ?
In 2014, it was Russia driving tanks into Ukraine, the Venezuelan devaluation and profit-taking after the 32% increase in the SP in 2013.
In 2015, it was falling crude oil, falling commodities, West Coast Port slowdown, strong dollar and even weather in February ’15.
In 2016, the volatility is the result of Financial stock volatility, European bank worries, negative interest rates, etc.
Not one of the last three Q1’s seems to be driven at all by the US economy and worries therein. Jobless claims remain strong.
So what gives? What is it with the first quarter every year?
I don’t know, but it is always something.
Viewpoints
I expect the following to be the principal positions, with the usual vigorous support for each, ranging from bearish to bullish.
- The reported data are flawed – a fluke, faked, subject to poor seasonal adjustments, etc. The economy is much weaker than the government claims.
- Good news for the economy just means that the Fed will tighten sooner. Only central banks have kept the market afloat.
- It is all about oil. Oil prices are the best economic barometer.
- Positive economic news will reduce recession fears, helping many stock sectors.
- Stronger economic news will lead to higher earnings estimates.
As always, I have my own opinion in the conclusion. But first, let us do our regular update of the last week’s news and data. Readers, especially those new to this series, will benefit from reading the background information.
Last Week’s Data
Each week I break down events into good and bad. Often there is “ugly” and on rare occasion something really good. My working definition of “good” has two components:
- The news is market-friendly. Our personal policy preferences are not relevant for this test. And especially – no politics.
- It is better than expectations.
The Good
On balance the news was very good last week, despite the market reaction.
- Initial jobless claims remained low at 272K.
- Q4 GDP was revised higher. This is backward looking, of course, but the revision to 1% growth suggests that the base for 2016 was a bit better.
- Existing home sales remained strong and beat expectations – 5.47M versus 5.3M. (Calculated Risk)
- Durable goods reversed nicely from the recent slump – up 4.9% overall and 1.8% on the core (ex-transportation).
- Low oil prices are starting to show benefits.
- Gas prices continue to fall. $1/gallon coming this summer? (Oilprice.com)
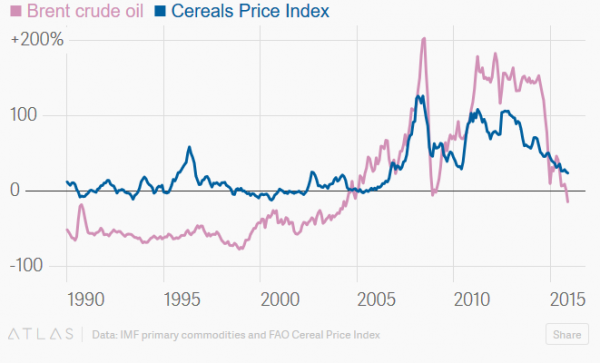
- Reduced food costs around the world. Quartz has the story and plenty of charts showing the relationship. Christopher Groskopf calls it a “huge hidden upside.”
While the global economy’s biggest players are reeling, there is a less visible group of people who stand to benefit tremendously: those without enough to eat.
The security of the world’s poor is inseparable from the price they pay for food, especially the grains that constitute most of their diet. Oil prices are a significant factor in determining the price of other commodities, including food. Tractors and other farm machinery require fuel, as does the manufacture of fertilizer. Once crops are harvested, oil prices dictate the transportation costs to get them to market, whether that’s down a highway or over an ocean.
- Michigan sentiment improved over January and slightly beat estimates. (But see Consumer Confidence below).
- Personal income and spending both surprised with 0.5% growth. This is good news for housing and the consumer sectors. Maybe the improved employment picture and lower gasoline costs are finally having an effect.
The Bad
Some of the news was negative.
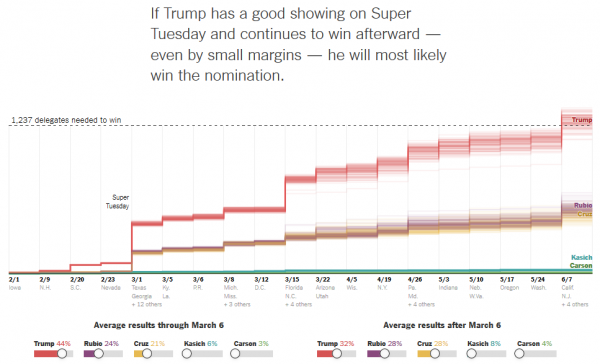
- Leadership worries. Early primary results have favored “outsider” candidates. In my 2016 preview I said that it was far too soon to draw conclusions about the Presidential election. Things are shaping up faster than I expected. Most observers note that markets prefer establishment candidates and stable leadership. We can and should each express our own viewpoints and vote our consciences, but our personal choices may not be “market friendly.” TheUpshot has an interesting interactive GOP simulator. You can plug in your own assumptions and use it to follow the news this week. They lead off with a favorable Trump scenario:
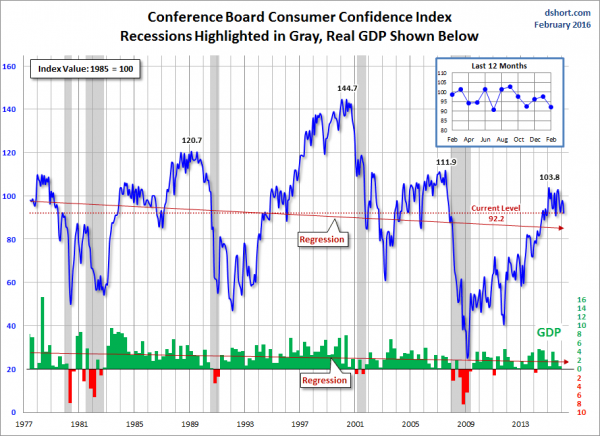
- Consumer confidence. Doug Short puts the disappointment in context.
- New home sales disappointed. The annualized level of 494K missed expectations by 25K and was down 50K from December.
- Signs of the “wealth effect” hit earnings. Restoration Hardware (N:RH) blames its earnings miss on the stock market. (Fortune).
The Ugly
University bond ratings. Three Illinois state universities were downgraded to junk or just above by Moody’s. Illinois is especially bad, but state revenues nationwide have been slow to rebound from recession levels.
Some Fun
For those watching the Academy Awards this weekend (missing the important basketball game between Michigan where I did my grad work and Wisconsin, where I taught and from which Mrs. OldProf graduated) here is some fun.
Which nominated films showed the most profit, either overall or on a percentage. (The winner should be easy).
What about The Big Short? Here are some reactions from Brookings, which hosted an event including interviews – the director, some of those involved in real life, and also other financial professionals.
The Silver Bullet
I occasionally give the Silver Bullet award to someone who takes up an unpopular or thankless cause, doing the real work to demonstrate the facts. Think of The Lone Ranger. No award this week. Nominations are always welcome!
Quant Corner
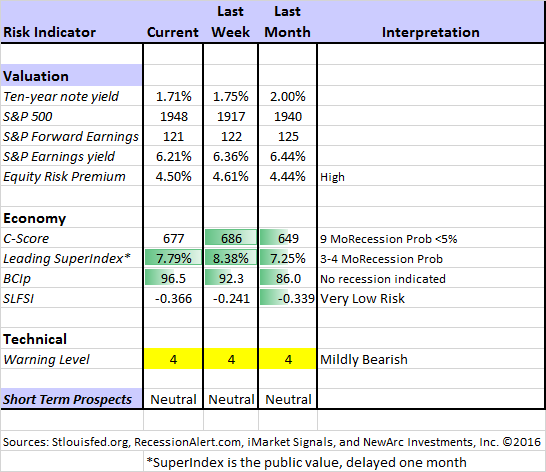
Whether a trader or an investor, you need to understand risk. I monitor many quantitative reports and highlight the best methods in this weekly update.
Beginning last week I made some changes in our regular table, separating three different ways of considering risk. For valuation I report the equity risk premium. This is the difference between what we expect stocks to earn in the next twelve months and the return from the 10-Year Treasury note. I have found this approach to be an effective method for measuring market perception of stock risk. This is now easier to monitor because of the excellent work of Brian Gilmartin, whose analysis of the Thomson-Reuters data is our principal source for forward earnings.
Our economic risk indicators have not changed.
In our monitoring of market technical risk, I am now using our new model, “Holmes”. Holmes is a friendly watchdog in the same tradition as Oscar and Felix, but with a stronger emphasis on asset protection. We have found that the overall market indication is very helpful for those investing or trading individual stocks. The score ranges from 1 to 5, with 5 representing a high warning level. The 2-4 range is acceptable for stock trading, with various levels of caution.
The new approach improves trading results by taking some profits during good times and getting out of the market when technical risk is high. This is not market timing as we normally think of it. It is not an effort to pick tops and bottoms and it does not go short.
Interested readers can get the program description as part of our new package of free reports, including information on risk control and value investing. (Send requests to info at newarc dot com).
In my continuing effort to provide an effective investor summary of the most important economic data I have added Georg Vrba’s Business Cycle Index, which we have frequently cited in this space. In contrast to the ECRI “black box” approach, Georg provides a full description of the model and the components.
For more information on each source, check here.
Recent Expert Commentary on Recession Odds and Market Trends
Bob Dieli does a monthly update (subscription required) after the employment report and also a monthly overview analysis. He follows many concurrent indicators to supplement our featured “C Score.”
Georg Vrba: provides an array of interesting systems. Check out his site for the full story. We especially like his unemployment rate recession indicator, confirming that there is no recession signal. He gets a similar result with the twenty-week forward look from the Business Cycle Indicator, updated weekly and now part of our featured indicators.
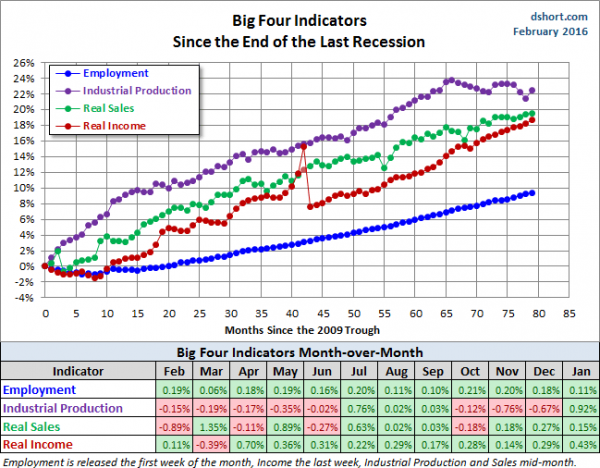
Doug Short: Provides an array of important economic updates including the best charts around. One of these is monitoring the ECRI’s business cycle analysis, as his associate Jill Mislinski does in this week’s update. His Big Four update is the single best visual update of the indicators used in official recession dating. You can see each element and the aggregate, along with a table of the data. The full article is loaded with charts and analysis. The latest update clearly shows the January strength.
RecessionAlert: A variety of strong quantitative indicators for both economic and market analysis. While we feature the recession analysis, Dwaine also has a number of interesting systems. These include approaches helpful in both economic and market timing. He has been very accurate in helping people to stay on the right side of the market.
Dwaine has introduced a new indicator, using only the timeliest data and a distinct improvement over the ECRI approach. Read the entire post for details and a number of interesting charts.
China is clamping down on negative data – omitting some from reports and fining journalists for negative reports. (NYT).
The Week Ahead
We have a huge week for economic data. While I highlight the most important items, you can get an excellent comprehensive listing at Investing.com. You can filter for country, type of report, and other factors.
The “A List” includes the following:
- Employment situation report (F). Still most important for markets.
- ISM index (T). Important read on the direction of manufacturing.
- Auto sales (T). Some suspect “peak auto” despite recent strength.
- ADP payroll growth (W). A solid alternative to official numbers.
- ISM services (Th). Less impact than manufacturing, despite covering more of economy.
- Initial Claims (Th). A lot of attention to the recent volatility in the best concurrent news on employment trends.
The “B List” includes the following:
- Pending home sales (M). Housing market remains crucial to the economic rebound.
- Fed beige book (W). Anecdotal information in front of the FOMC at the March meeting.
- Construction spending (T). Volatile but important January data.
- Factory orders (Th). January data. A rebound is expected?
- Chicago PMI (M). Last month’s strength to be repeated?
- Trade balance (F). Significant component for Q1 GDP.
- Crude oil inventories (W). Attracting a lot more attention these days.
The election stories may well dominate the discussion until Wednesday. Earnings reports continue. Some FedSpeak is on the schedule, most importantly Vice-Chair Fischer on Monday.
How to Use the Weekly Data Updates
In the WTWA series I try to share what I am thinking as I prepare for the coming week. I write each post as if I were speaking directly to one of my clients. Each client is different, so I have six different programs ranging from very conservative bond ladders to very aggressive trading programs. It is not a “one size fits all” approach.
To get the maximum benefit from my updates you need to have a self-assessment of your objectives. Are you most interested in preserving wealth? Or like most of us, do you still need to create wealth? How much risk is right for your temperament and circumstances?
WTWA often suggests a different course of action depending upon your objectives and time frames.
Insight for Traders
We continue both the neutral market forecast, and the bearish lean. Felix is still 100% invested, but with more aggressive choices than last week. The more cautious Holmes is only about 1/4 invested. For more information about Felix, I have posted a further description — Meet Felix and Oscar. You can sign up for Felix and Oscar’s weekly ratings updates via email to etf at newarc dot com. They appear almost every day at Scutify (follow here). I am trying to figure out a method to share some additional updates from Holmes, our new portfolio watchdog. (You learn more about Holmes by writing to info at newarc dot com.
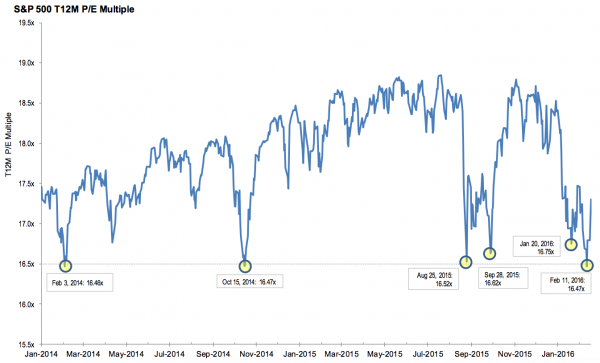
Oppenheimer’s John Stoltzfus has an idea about trading the bottom of the range. (BI).
How to “pull the trigger” on a trading idea. One idea: Start small. (Finance Trends)
Finding edge in your trading ideas – new information or a fresh look at existing data. (Brett Steenbarger)
Insight for Investors
I review the themes here each week and refresh when needed. For investors, as we would expect, the key ideas may stay on the list longer than the updates for traders. Major market declines occur after business cycle peaks, sparked by severely declining earnings. Our methods are focused on limiting this risk. Start with our Tips for Individual Investors and follow the links.
We also have a page (recently updated) summarizing many of the current investor fears. If you read something scary, this is a good place to do some fact checking. Pick a topic and give it a try.
Many individual investors will also appreciate our two new free reports on Managing Risk and Value Investing. (Write to info at newarc dot com).
Other Advice
Here is our collection of great investor advice for this week.
If I had to pick a single most important source for investors to read, it would be Philip Van Doorn’s MarketWatch piece on how to enhance returns with covered calls. This is a great job of demystifying the subject. He writes:
I promise to explain a “covered call” option strategy as painlessly as possible.
If you’re an investor seeking income, buying quality securities that pay high dividends or interest is a prudent strategy. But covered call options can boost income while providing downside protection. And that’s important nowadays, as some analysts are predicting a bear market for stocks, and traders expect low interest rates for quite a while.
There are many ways of implementing this strategy, with a significant effect on risk and returns. I have been using it for years, emphasizing the sale of near-term calls with the fastest time decay. Interested readers might enjoy my free report comparing this approach to other income programs like bonds, REITs, and dividend investing. (info at newarc dot com).
With information in hand, you can try it yourself. Start small!
Stock and Fund Ideas
Warren Buffett’s (N:BRKa, N:BRKb) annual Shareholder Letter (HT Josh Brown). Hot news that will lead the talk on Monday morning.
Barron’s likes Walmart (N:WMT), but thinks utilities have gotten too expensive. I agree.
Finding good ideas requires thinking beyond yesterday’s news. Here are some suggestions on how to do it. And a few more.
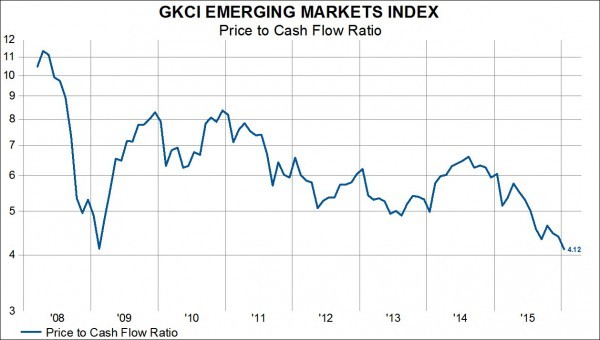
Emerging market stocks are very cheap (GaveKal).
Energy Price
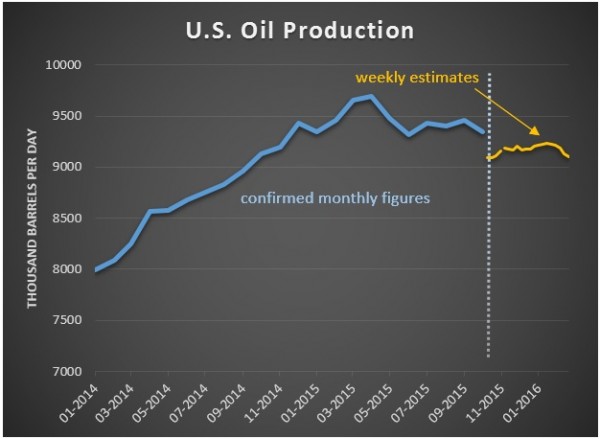
U.S. production is declining. Oil & Energy Insider has plenty of good data, and this chart:
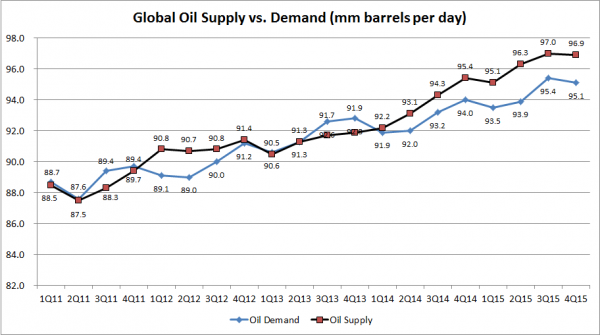
George Trager of Investbrain.Net (via ValueWalk) explains the supply and demand behind oil prices in four charts. I especially liked this one:
Watch out for….
Tax scams. Hackers posing as the IRS try to steal your money. The IRS does not ask for money over the phone nor does it take credit card payments. The IRS has also admitted that even more taxpayer information has been compromised. Sheesh!
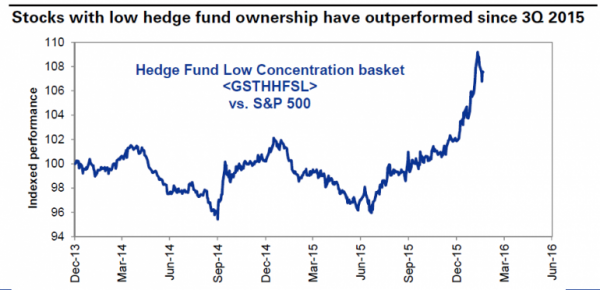
Hedge fund favorites. Low ownership has been good! What do those guys know, anyway? (ValueWalk).
Personal Finance
Professional investors and traders have been making Abnormal Returns a daily stop for over ten years. The average investor should make time (even if not able to read AR every day as I do) for a weekly trip on Wednesday. Tadas always has first-rate links for investors in this special edition. There are several great posts, but I especially liked MIT economist Erik Brynjolfsson’s explanation of why it is better to own than to rent your home. It is very good. (BI)
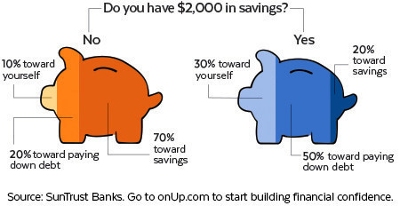
With tax season upon us, some people will have refunds to spend. Here is some excellent advice on putting the cash to good use. Hint: Take a little for spending but pay off loans or save with most. (SunTrust)
Final Thoughts
There is plenty of negative sentiment right now, despite the recent stock rebound. I do not expect any single news release – or even a series of them – to have a dramatic impact on stocks. Until a stronger economy influences earnings, most people will remain skeptical. We might well be three months away from seeing that evidence, even if the Q1 data continue to improve.
The recessionistas will be proven wrong on the current call, and that will gradually help to improve earnings estimates. Many analysts are building recessions into their forecasts, second-guessing their own top economists.
It is difficult to be patient, but it is often rewarding. Take what the market is giving you – a trading range with some sector and stock-specific opportunities.
Personal Note
Thanks to Brian at Investor in the Family for the invitation be interviewed on his podcast. We covered some interesting market topics.

