In this article I will provide my view on the EUR/NZD and the NZD/CAD. These are the pairs that I am currently interested in or was interested in last week for trading with the FxTaTrader strategy. I will pick one to analyze in more detail from the pairs that have not been discussed yet recently.
- All trades are based on specific rules according to the strategy.
This article will provide:
- The weekly currency chart for the analyzed pair.
- The weekly (decision) TA chart for the analyzed pair.
- A Technical analysis for the analyzed pair of the Monthly, Weekly and Daily chart.
- Possible positions for the coming week and positions taken.
Because of the exceptional event last week with the CHF pairs containing this currency can best be avoided in the coming period. More news about this can be found on many FX websites like FxStreet, Investing, MyFxBook etc. For this reason I will use this week the Top 15 instead of the Top 10 of the Ranking and Rating list to look at the interesting pairs.
According to the TA Charts, the "Currency score" and the "Ranking & Rating list" all the pairs in the Top 15 of the "Ranking & Rating list" are good to trade but the following pairs are not (yet) qualified according to the FxTaTrader Strategy rules or because of the exceptional event last week with the CHF.
- All the CHF pairs can best be avoided because of the high volatility in the coming period.
- The EUR/NZD. This pair is far away from the Bollinger Band and a good pull back has to take place to make it interesting again for taking positions.
- The USD/CAD and NZD/CAD are on a slightly distance of the outside Bollinger Band. When the trading week starts the Bollinger Band will show its new value which will be in the direction of the trend and most probably the mentioned pairs will then come inside the Bollinger Band.
- The EUR/JPY is a pair with 2 weaker currencies with a currency score difference of only 3. See the Currency score article of this weekend Forex Weekly Currency Score Week 3 for more information.
When trading according to the FxTaTrader Hybrid Grid Strategy some rules are in place. For more information see the page on my blog FxTaTrader Hybrid Grid Strategy. Depending on the opportunities that may come up the decision to trade a currency may become more obvious at that moment.
Open/pending positions of last week
EUR/NZD
This pair will be analyzed briefly, for more information read the article Weekly Review Strategy Week 1 where the pair was tipped for going short. Last week appeared to be again an unlucky week for opening short positions on this pair. The pull back was taking place during the week and the pair even came inside the Weekly Bollinger Band. However, everything changed on Thursday because of the exceptional event that took place with the CHF and the pair is again far away of the Bollinger Band. No positions have been opened. For the coming week the EUR and CHF pairs will be avoided with the Weekly strategy because of the high volatility.
- In the weekly chart the Ichimoku is meeting all the conditions.
- The MACD is in negative territory and gaining strength.
- The Parabolic SAR is short showing the preferred pattern of lower stop loss on opening of new long and short positions.
Ranking and rating list Week 3
Rank: 9
Rating: - -
Total outlook: Down
Possible positions for coming week
NZD/CAD
This pair will be analyzed in detail. The pair had a strong rally in the last few weeks and the Weekly chart has improved significant. It also has a lot of space to go up to the last high at 0,9655.
- As can be seen in the Currency Score chart in my previous article of this weekend Forex Weekly Currency Score Week 3, the NZD is having a score of 6 and the CAD a score of 2. With a Currency score difference of 4 and the NZD having a classification of an strong currency while the CAD is an average currency it is an interesting pair in the coming week for going long.
- The position in the Ranking and Rating list in the last weeks also shows that the pair is attractive for taking long positions. In the current list of this weekend Forex Ranking & Rating Week 3 the pair has a rank of 14. This list is used as additional information besides the Currency score and the Technical analysis charts.
- Besides the general information mentioned the outlook in the TA charts also makes it an attractive opportunity.
Ranking and rating list Week 03
Rank: 14
Rating: + +
Weekly Currency score: Up
Based on the currency score the pair looked interesting in the last 3 months. The NZD is a stronger currency from a longer term perspective and currently having a currency score of 6. The CAD is an average currency from a longer term perspective and currently having a score of 2. Based solely on this information the pair does look interesting for going long in the coming week.
Monthly chart: Up
- On the monthly (context) chart the indicators are looking strong for going long.
- The Ichimoku is meeting all the conditions.
- The MACD is in positive area and regaining strength.
- The Parabolic SAR is short but showing the preferred pattern of higher stop loss on opening of new long and short positions.
- Since the monthly chart is used to get the context how that pair is developing for the long term the indicators are looking fine because they are showing strength in the current uptrend.
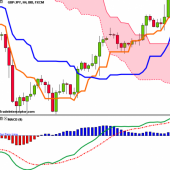
Weekly chart: Up
- On the weekly (decision) chart the indicators are looking reasonable for going long.
- The Ichimoku is meeting all the conditions.
- The MACD has just entered the positive area and is gaining strength.
- The Parabolic SAR is long but not showing the preferred pattern of higher stop loss on opening of new long and short positions.
Daily chart: Up
- On the daily (timing) chart the indicators are looking strong for going long.
- The Ichimoku is meeting all the conditions.
- The MACD is in positive area and gaining strength.
- The Parabolic SAR is long and showing the preferred pattern of higher stop loss on opening of new long and short positions.
Total outlook: Up
NZD/CAD Weekly chart
Although the explanation may seem simple and clear there is always risk involved. I added a disclaimer to my blog for this purpose. If you would like to use this article then mention the source by providing the URL FxTaTrader.com or the direct link to this article. Good luck in the coming week and don't forget to check my weekly forex "Ranking and Rating list" and the "Currency Score".
DISCLAIMER: The articles are my personal opinion, not recommendations, FX trading is risky and not suitable for everyone.The content is for educational purposes only and is aimed solely for the use by ‘experienced’ traders in the FOREX market as the contents are intended to be understood by professional users who are fully aware of the inherent risks in forex trading. The content is for 'Forex Trading Journal' purpose only. Nothing should be construed as recommendation to purchase any financial instruments. The choice and risk is always yours.