Open/pending positions of last weeks
This pair will be analyzed briefly; for more information, read the article Weekly Review Strategy Week 31 where the pair was tipped for going short.
Positions were opened for this pair and one was closed with profit. Unfortunately, the second position was closed on August 10 because of the strong pullback.
The trend is still down, however, the momentum has to come back for taking short positions again.
From a longer term perspective, the pair succeeded on July 3 to close and break through the lows of March and April at 0,7535. Since then it remains an interesting pair for taking short positions.
The AUD is one of the weakest currencies with a currency score of 3 being above the CAD(2) and the NZD(1). The USD is at the moment one of strongest currency with a score of 6 being below the EUR(7) and the GBP(8).
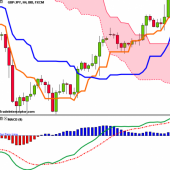
- On the weekly (decision) chart, the indicators are looking strong for going short.
- In the weekly chart, the Ichimoku is meeting all the conditions.
- The MACD is in negative area, but the histogram is rising and the MACD is consolidating.
- The Parabolic SAR is short and showing the preferred pattern of lower stop loss on opening of new long and short positions.
Ranking and rating list, Week 34
Rank: 12
Rating: -
Total outlook: Down
Possible positions for coming week
This pair will be analyzed in detail. The pair is clearly in an uptrend and it is gaining momentum. From a longer term perspective, it broke through a previous significant resistance around 2,1030 on May 11. It is a pair to monitor in the coming week and it is again around a resistance level at 2,400. Once this level gets broken with an increase of momentum, it becomes interesting.
- As can be seen in the Currency Score chart in my previous article of this weekend, the GBP has a score of 8 and the NZD a score of 1.
- In the current Ranking and Rating list of this weekend, the pair has a rank of 1. This list is used as additional information besides the Currency score and the Technical Analysis charts.
- Besides the general information mentioned, the outlook in the TA charts also makes this an attractive opportunity.
Ranking and rating list Week 34
Rank: 1
Rating: + + +
Weekly Currency score: Up
Based on the currency score, the pair looked interesting since the end of May. The USD is a strong currency from a longer term perspective and after the pullback in May, it found the uptrend again. The AUD is a weak currency from a longer term perspective and it remains weak. This offers an opportunity. With currently a Score difference of 7 and the USD being better classified, it is an interesting pair for taking positions in the coming week.

Monthly chart: Up
- On the monthly(context) chart, the indicators are looking strong for going long.
- The Ichimoku is meeting all the conditions.
- The MACD is in positive area and gaining momentum.
- The Parabolic SAR is long and showing the preferred pattern of higher stop loss on opening of new long and short positions.
- Since the monthly chart is used to get the context how that pair is developing for the long term, the indicators are looking fine because they are showing strength in the current uptrend.
Weekly chart: Up
- On the weekly(decision) chart, the indicators are looking strong for going long.
- The Ichimoku is meeting all the conditions.
- The MACD is in positive area and gaining momentum.
- The Parabolic SAR is long and showing the preferred pattern of higher stop loss on opening of new long and short positions.
Daily chart: Up
- On the daily(timing) chart, the indicators are looking strong for going long.
- The Ichimoku is meeting all the conditions.
- The MACD is in positive area, but the histogram is consolidating.
- The Parabolic SAR is long and showing the preferred pattern of higher stop loss on opening of new long and short positions.
Total outlook: Up

GBP/NZD Weekly chart
If you would like to use this article, then mention the source by providing the URL FxTaTrader.com or the direct link to this article. Good luck in the coming week and don't forget to check my weekly forex "Ranking and Rating list" and the "Currency Score."
DISCLAIMER: The articles are my personal opinion, not recommendations, FX trading is risky and not suitable for everyone.The content is for educational purposes only and is aimed solely for the use by ‘experienced’ traders in the FOREX market, as the contents are intended to be understood by professional users who are fully aware of the inherent risks in forex trading. The content is for 'Forex Trading Journal' purpose only. Nothing should be construed as recommendation to purchase any financial instruments.