US indices have now risen 3 weeks in a row. For the week, SPX, DJIA and RUT all rose 0.7%. NDX continues to lead; it rose 1.3%.
For the first time in at least a half year, all four US indices are simultaneously at new bull market highs. SPX, DJIA and RUT are at all-time highs and NDX is at a 15 year high. Theoretically, at new highs, there are no unprofitable shareholders and thus no forced sellers. The path of least resistance is usually higher until the market becomes overbought.
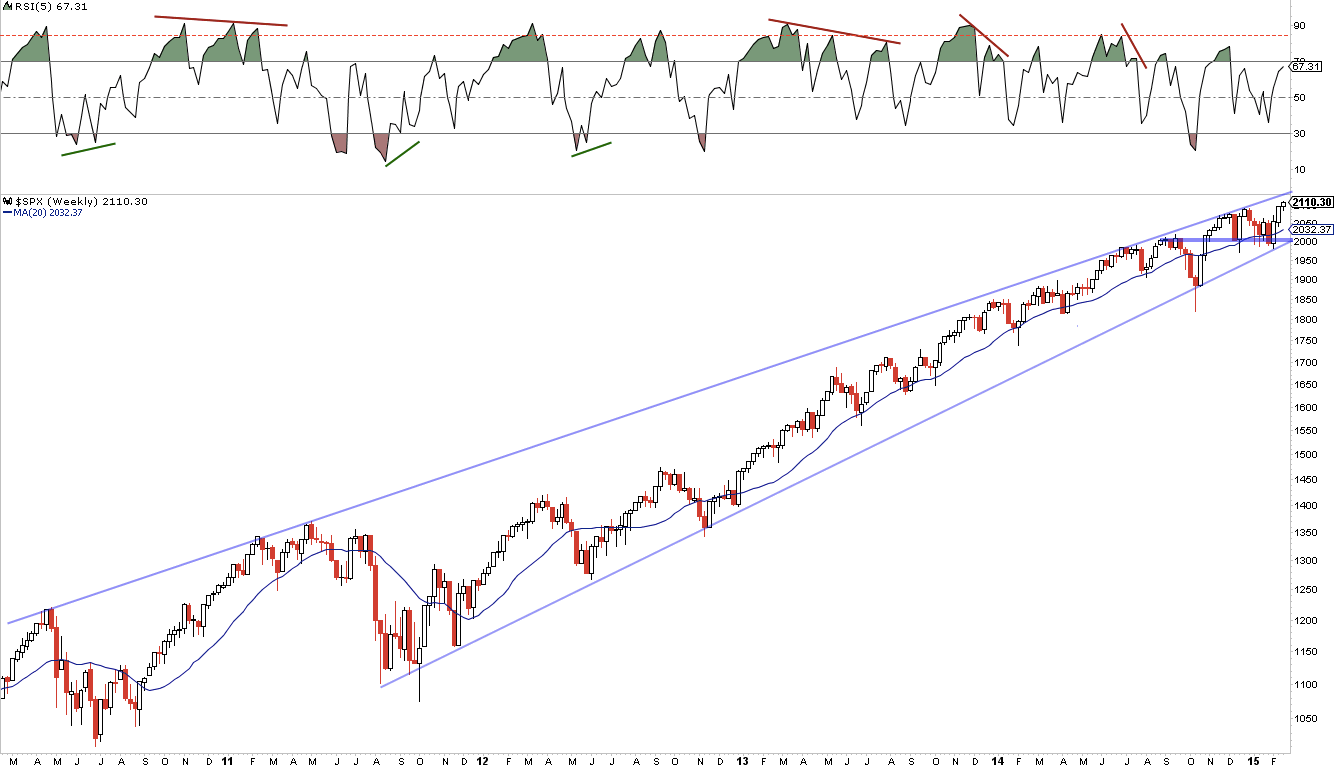
On weekly timeframes, the indices are not yet overbought; note RSI in the top panel in the chart below. SPX is nearing a 5 year channel top but it's about another 2% higher at roughly 2150. Of course, SPX can travel along the top of that channel for several weeks, as it did at the end of 2014.
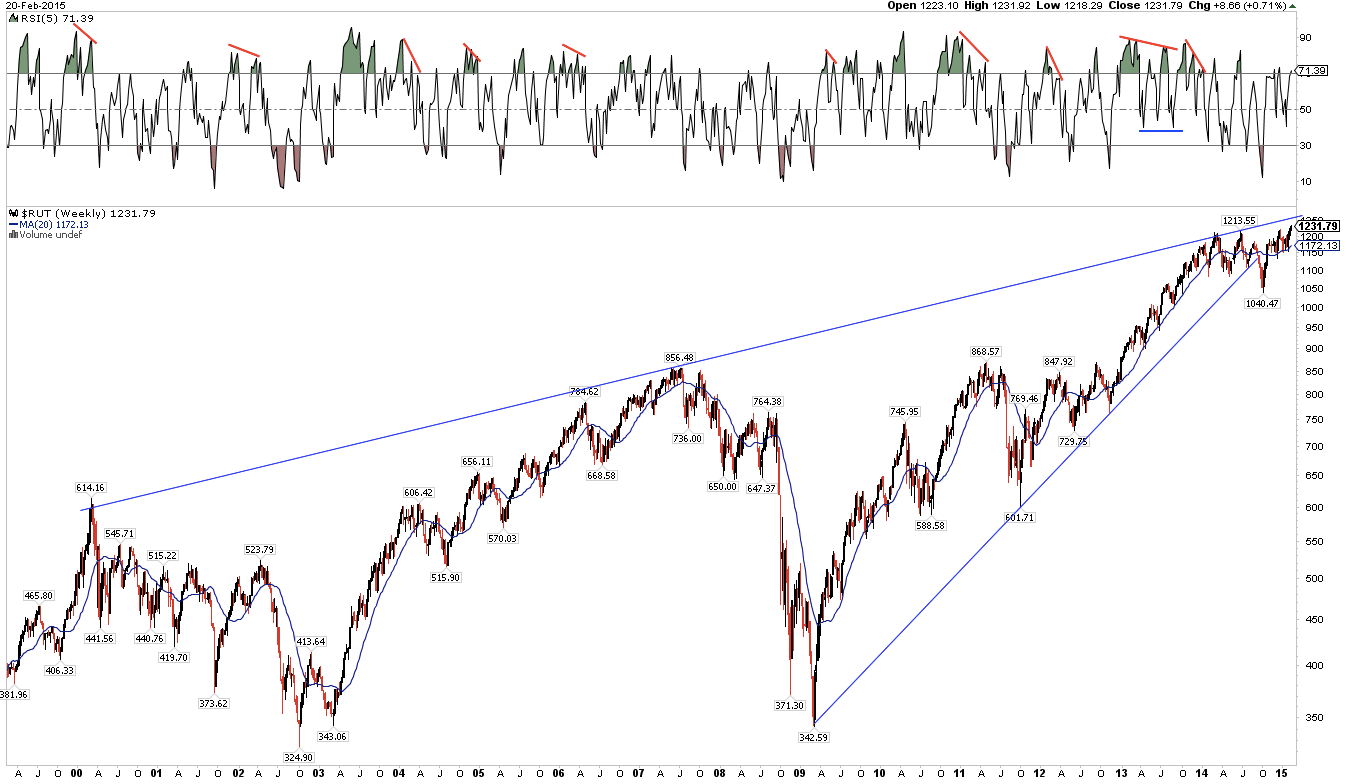
RUT is similar - about 2% from a channel top - except in this case the top trend line extends back 15 years.
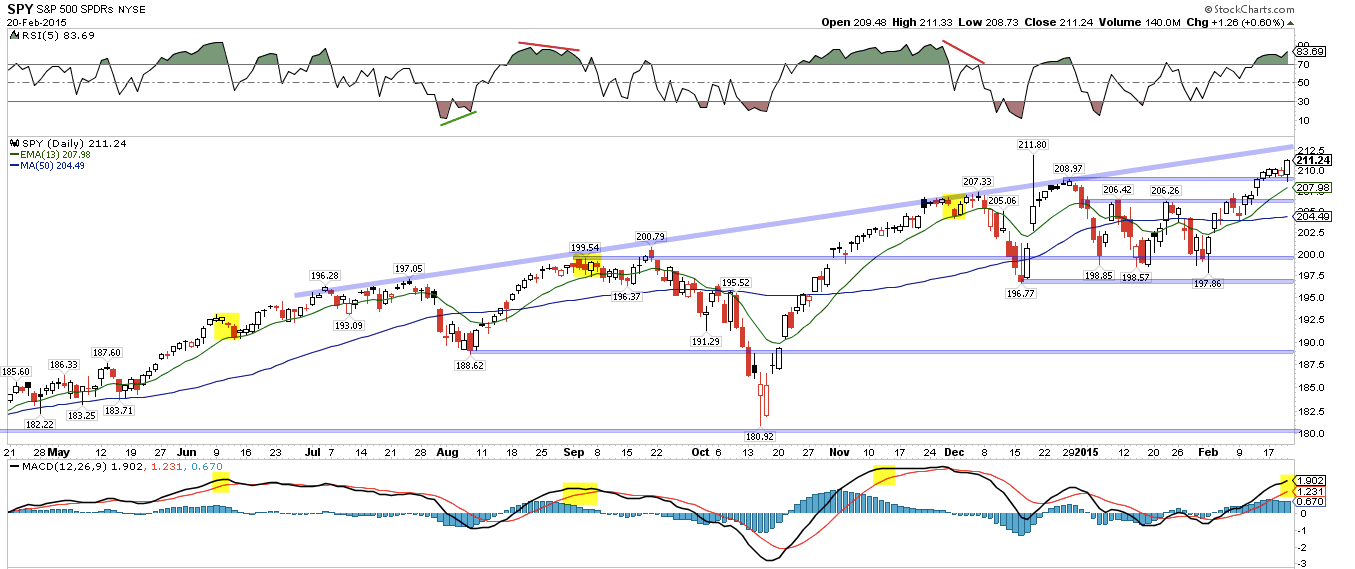
The picture is slightly different on a daily timeframe. Below is the chart for the SPDR S&P 500 ETF (ARCA:SPY). It is only about 0.7% from an 8 month channel top. Importantly, there has been no notable deterioration in momentum; in the bottom panel, MACD is still yawning. We would normally expect SPY to test its rising 13-ema (green line; now at 208), and then retest the recent high before pulling back more significantly (yellow shading). In other words, SPY seems to still be in the initial thrust off the low.
Could it fail earlier? Yes. This is precisely what happened at the end of December. The big difference now is that all four indices are synchronized; in December, NDX was the very notable laggard, making a lower high.
So, a decline to the 13-ema, should it take place this week, would probably be an attractive entry point for a retest of the high, especially if confirmed by other indicators (like put/call or Trin).
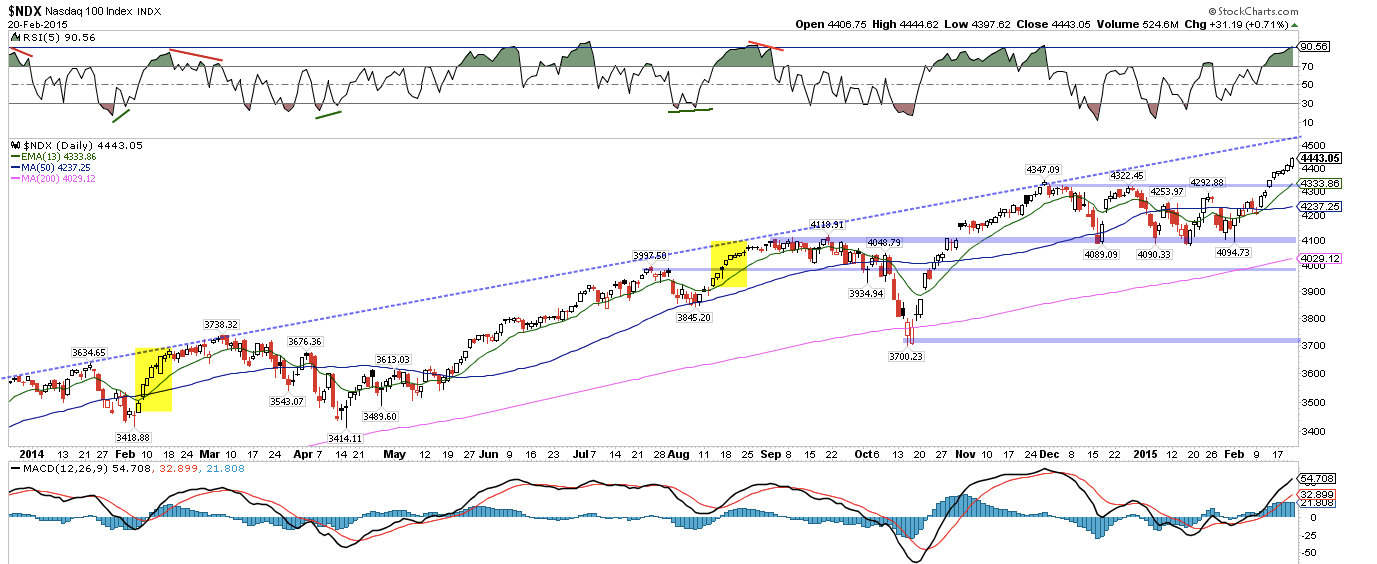
A decline this week wouldn't be surprising. NDX is now up 8 days in a row. In the past 3 years, that has happened just 3 times. The last two are shown below (yellow shading). NDX went to a higher high each time but the dominant pattern was sideways over the next several weeks.
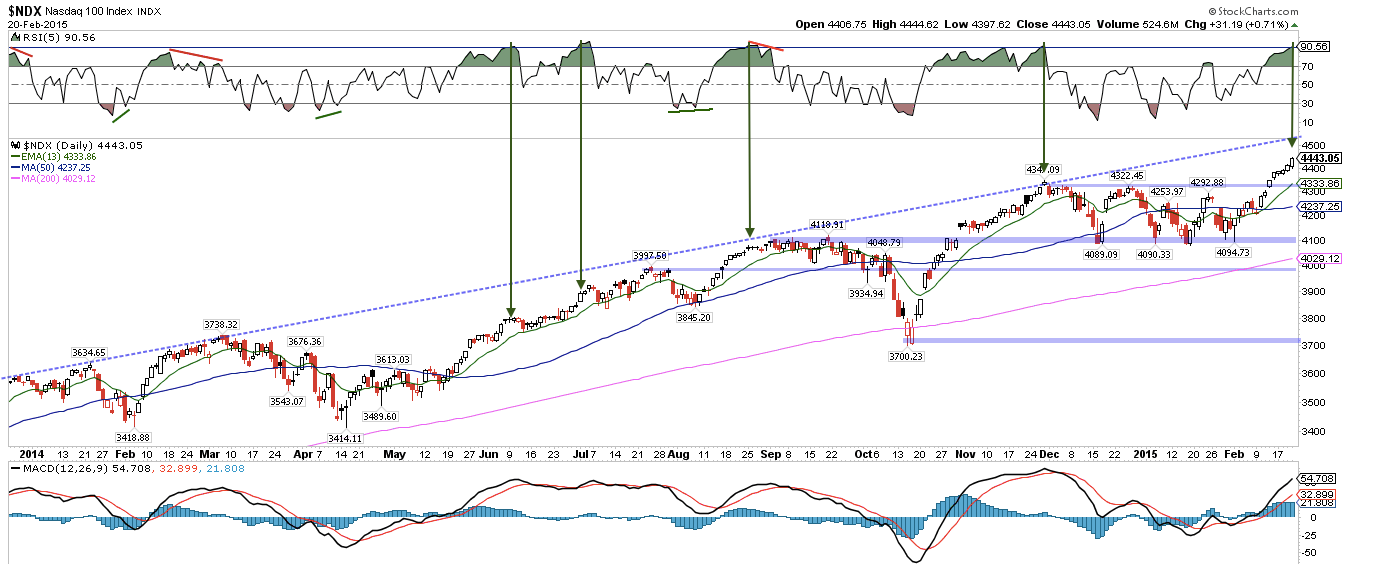
NDX's RSI(5) is also now at 90 (top panel, below). In the past 14 months, that has happened four other times (arrows). The index should make a higher high, but a small decline or sideways pattern occurred first each time in the past.
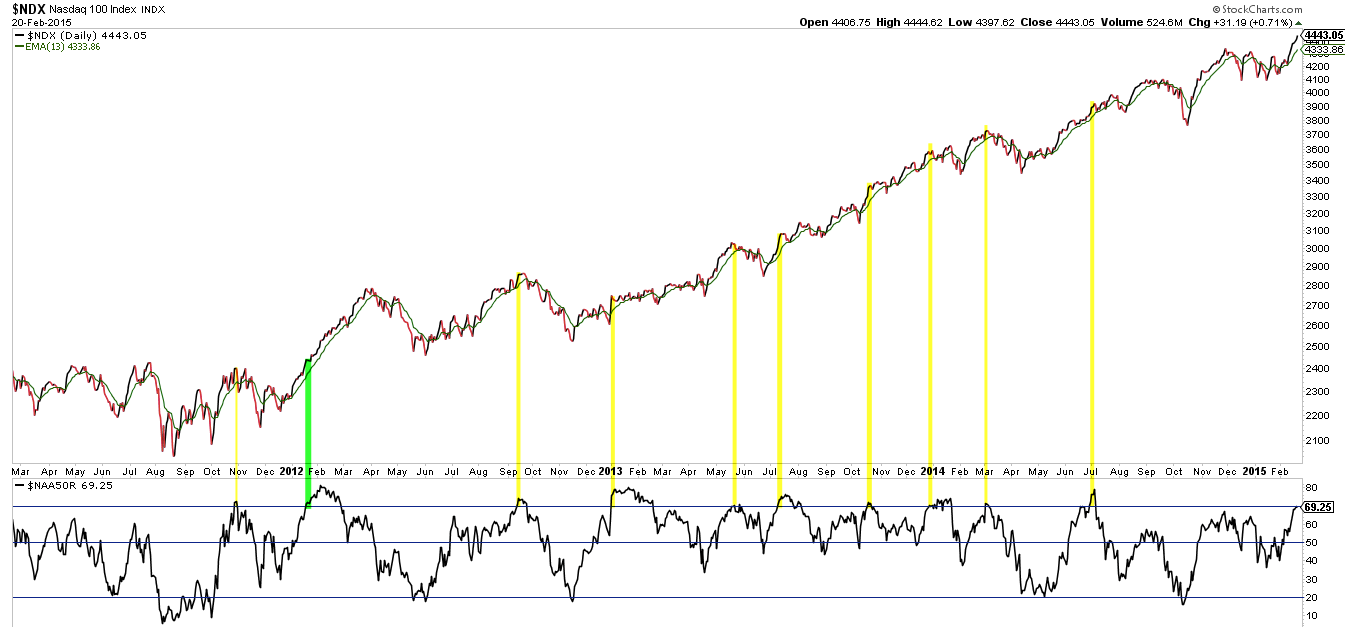
Breadth has improved. For NDX, 69% of NASDAQ companies are above their 50-dma and 56% are above their 200-dma. That's the best either has been since July.
The conventional wisdom says that expanding breadth shows broadening participation in the rally and is therefore bullish. Sometimes it is but not always.
We show the last 10 times breadth was this strong over the past 4 years below. Of those 10 times, 4 coincided with a relative peak in the NDX and 5 coincided with sideways choppiness over the next several weeks. In only 1 of those 10 times did NDX march steadily higher (green line).
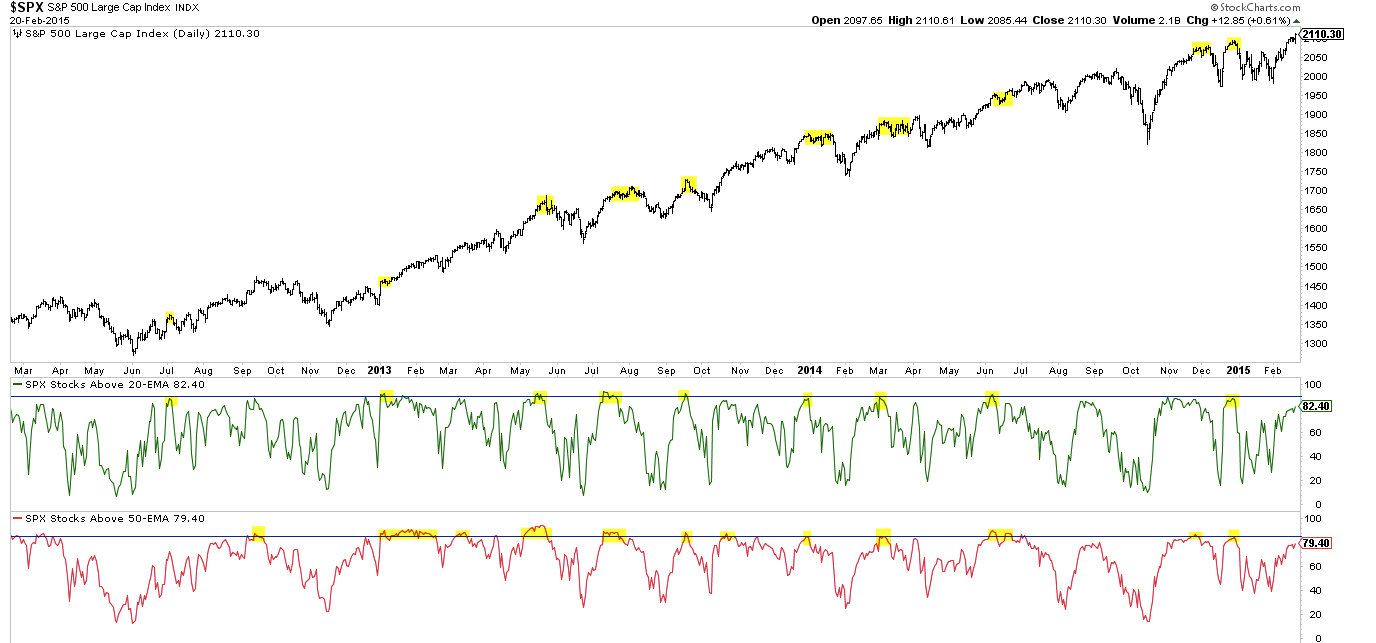
Breadth has also improved in SPX. It's not overbought like NDX. 82% of companies are above their 20-ema and 79% above their 50-ema. This is the best breadth in SPX since December. The index can become overbought when 90% and 85% are above their 20-ema and 50-ema, respectively (yellow shading). Not yet.
A recent and more complete discussion on breadth can be found here.
Another useful measure of breadth is Trin (also known as the Arms Index). During the recent rally, Trin sunk to extreme lows. This normally happens when advancing issues is greatly exceeded by advancing volume.
What does that imply? Usually, it means that the advance is reaching a short-term point of exhaustion. In the chart below, similar instances are highlighted. In most cases (not all), SPY moved towards its 13-ema in the next week. This can be through price (decline) or time (sideways to allow the 13-ema to catch up).
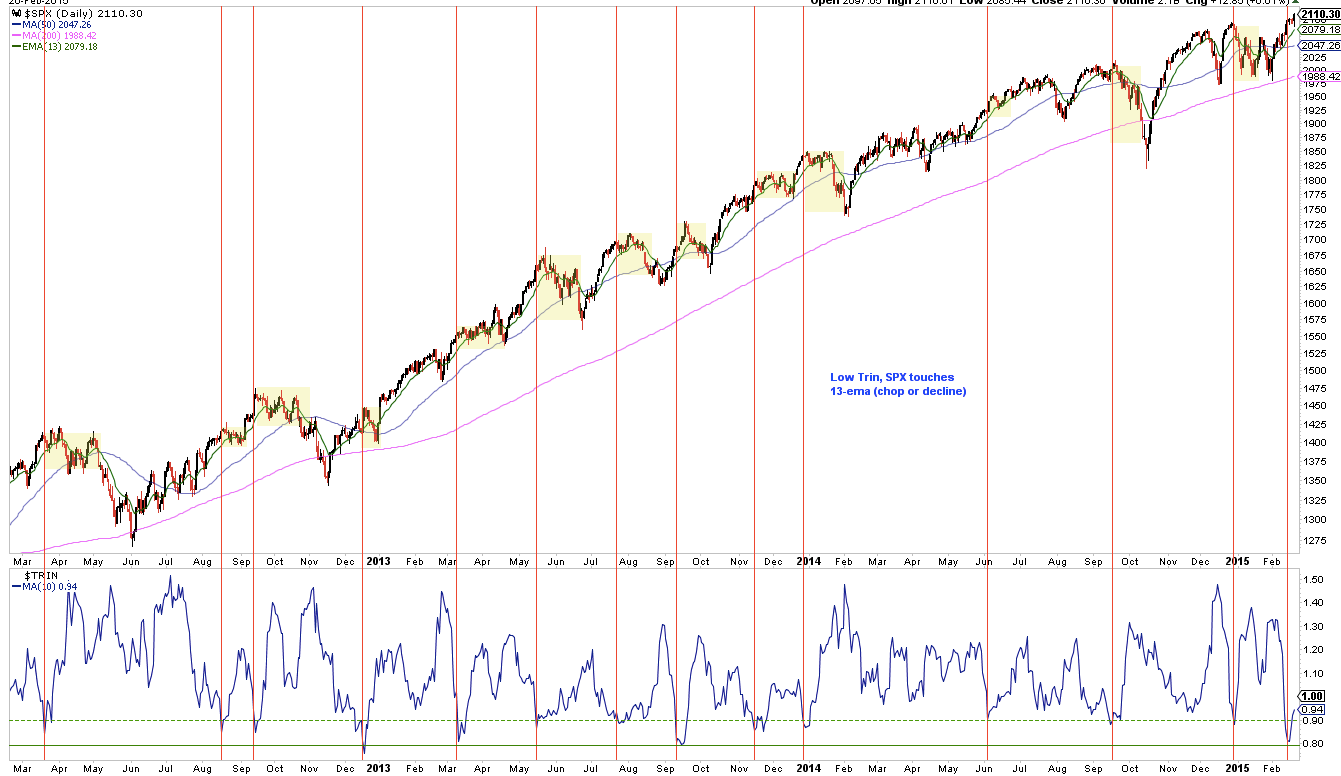
In the chart above, most (not all) of these instances went on to a higher high, so it was not the end of the rally.
In summary, the trend in the indices is strong and clearly pointing higher. Breadth is improving. But there are a number of indications that the advance is getting overheated short term. It wouldn't be surprising to see a move sideways or down to the rising 13-ema soon.
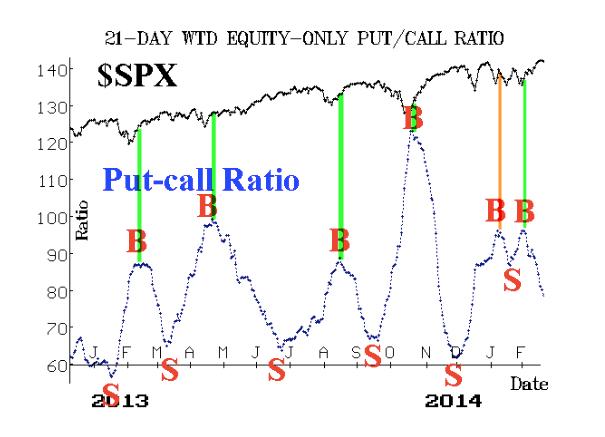
Short term sentiment is still favorable. The equity put/call ratio is still declining from an elevated level. There is considerable room for these ratios to move down (chart from McMillan).
Similarly, inflows to equity ETF and mutual funds were positive a second week in a row. Since December, fund outflows had totaled a substantial $27b. The inflow this week was small in comparison ($3.6b). In the chart below, we have highlighted market peaks; based on this measure at least, further inflows are likely before the market is at risk of a larger decline.
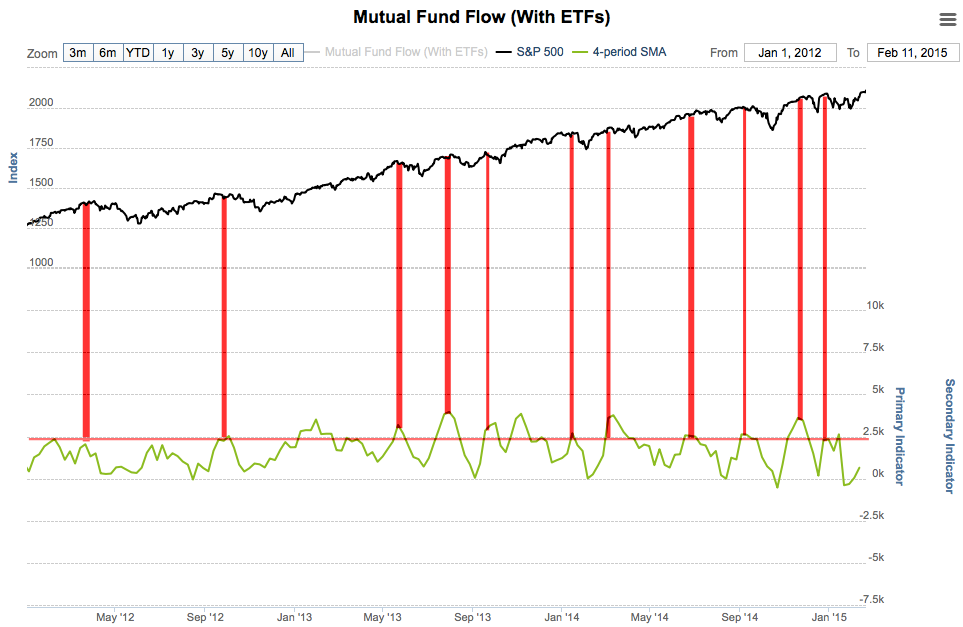
There is an alternative interpretation, however. The indices are moving to new highs but fund inflows are light. It could be that investors are so confident in the rally that they are buying individual stocks instead of funds. That, of course, would be negative.
Fund managers are demonstrably more confident in the rally. Driven by Europe, fund managers surveyed by BAML now have the fourth highest allocation to global equities since the rally began six years ago. Similar instances since 2007 are highlighted (green). There has been a clear tendency for equities to struggle in the next month, or longer. The most recent similar case was in July: SPY moved sideways for a month before declining 5% in early August (chart from BAML).
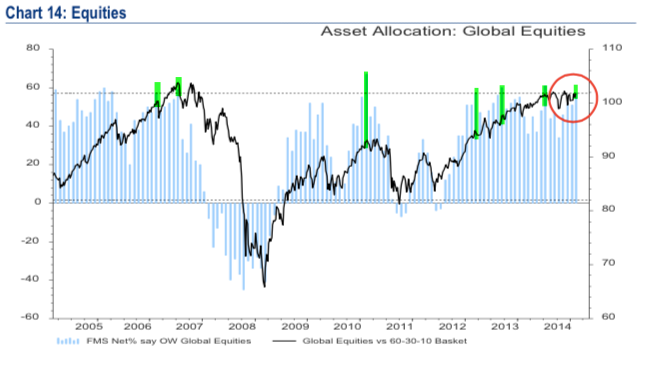
A post from this week on fund managers' asset allocation can be found here.
A final thought on sentiment: a popular measure is CNN's "Fear and Greed" barometer. On Friday, this hit a relative extreme of 80. Similar instances are shown below (green). In the past 3 years, there were 6 other instances; only one coincided exactly with a notable top. The others made higher highs for as long as two more months (arrows).
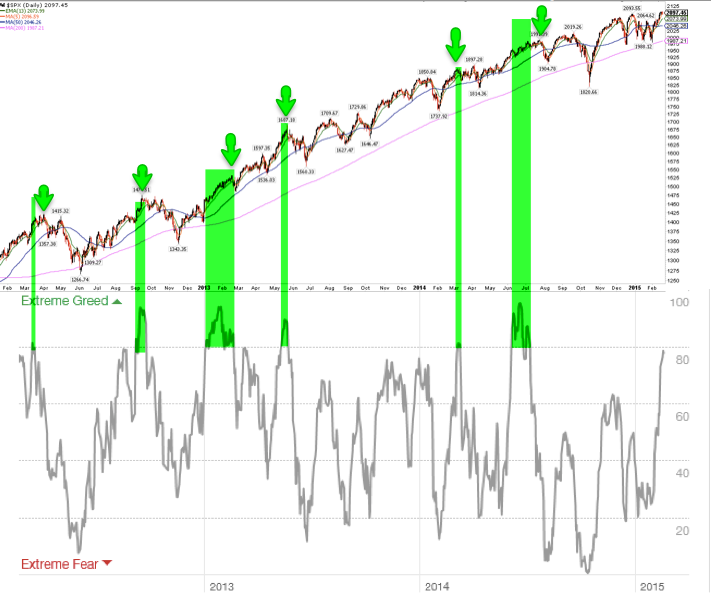
It's a small sample. But one message from this is that risk/reward is becoming less attractive. That would certainly be the case should the indices continue to rise unabated. Not only would "Fear and Greed" become extreme but so would some of the breadth measures mentioned earlier, as well as put/call ratios.
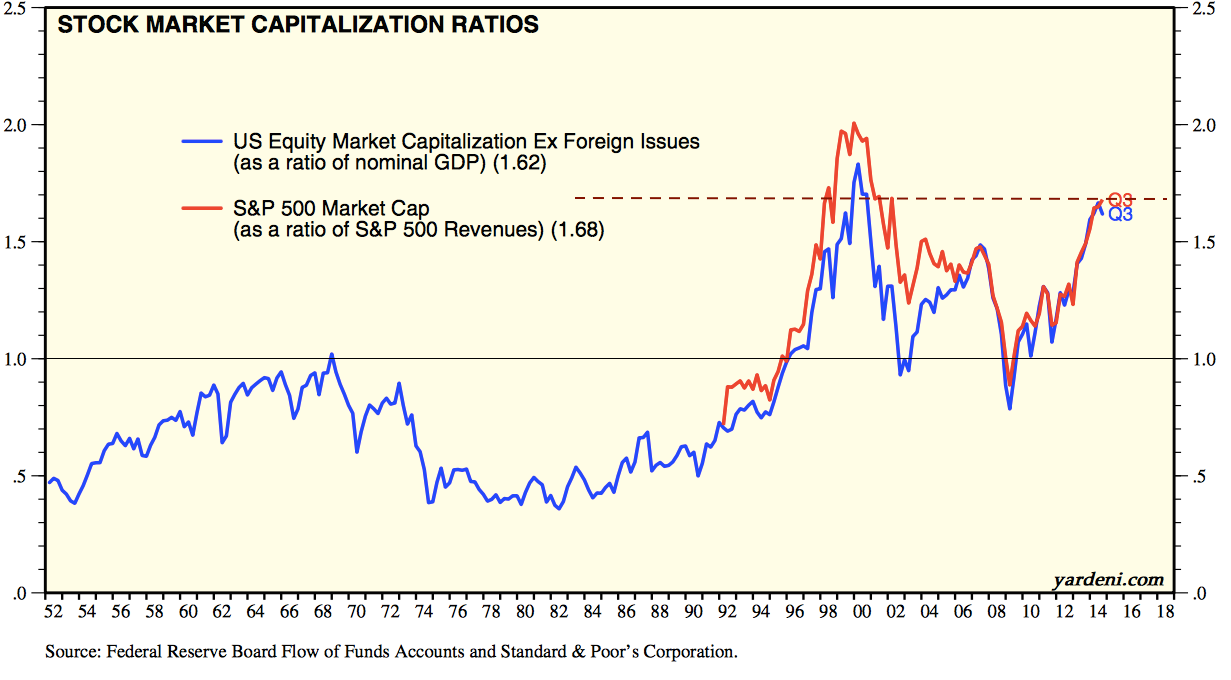
It's also worth noting that valuation metrics are stretched. We estimate price to sales to be over 1.75 at present. That is equivalent to the late 1990s; in that instance, price to sales reached 2.0, so there is a precedent for higher valuation ratios, but, based on current financials, US equities are expensive (chart from Yardeni).
There is no notable seasonal bias in the last week of February nor in the week after February OpX. That said, a strong move up during any OpX is often followed by weakness the following week (chart from Rob Hanna).

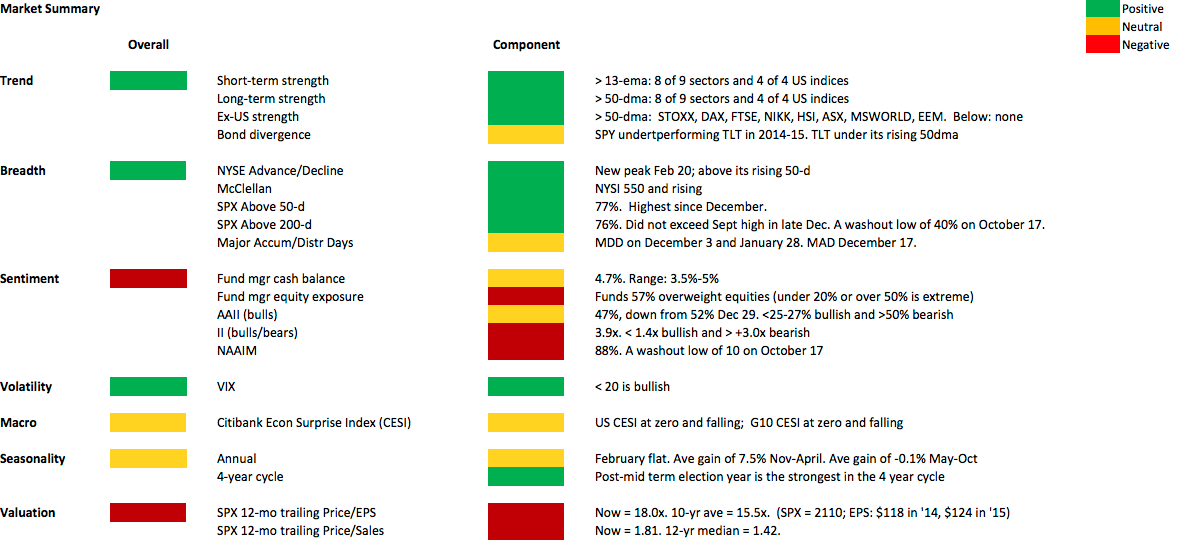
Our weekly summary table follows.
