Summary: The SPDR S&P 500 Fund (NYSE:SPY) has moved nearly 3% higher over the past two weeks. The S&P is now within about 1% of where every rally in the past 16 months has faltered. Is it likely to falter now as well?
Some short-term measures of sentiment may show excessive bullishness. The seasonal pattern is also a slight headwind. Taken together, it's not hard to imagine upside being limited in the near term.
But longer-term measures of sentiment, especially fund flows, suggest that further gains are still ahead. This means that any short term weakness is a set-up for higher prices into summer.
In our last market summary two weeks ago, the near term set-up was for higher prices in the following weeks. In the event, SPY has gained nearly 3% since then. That post is here.
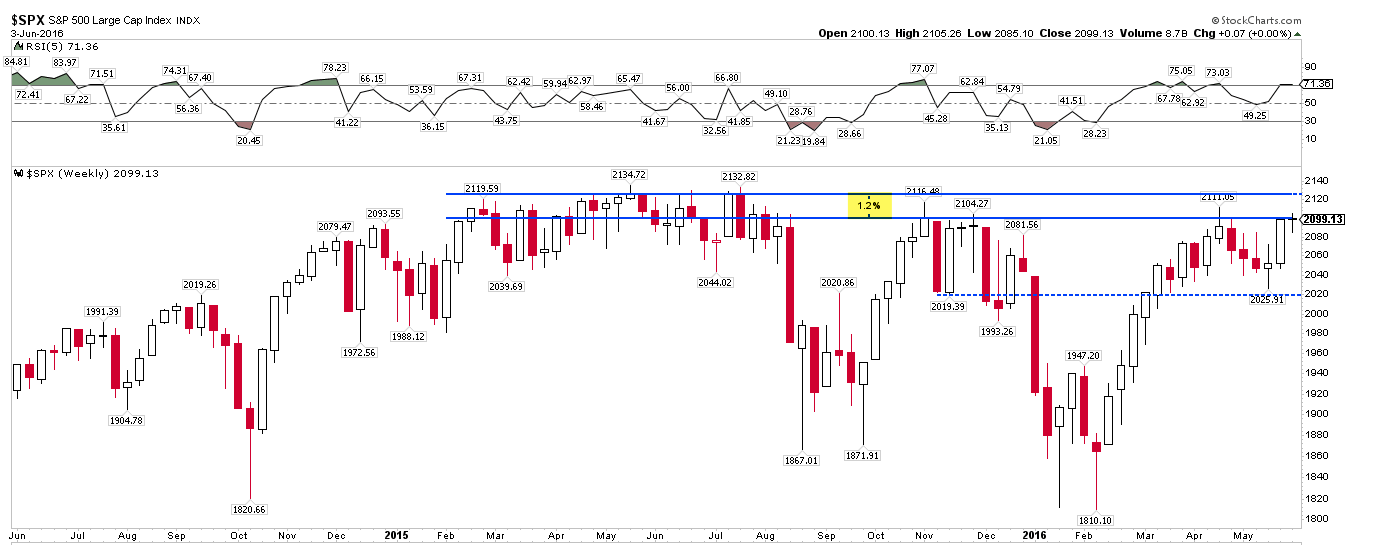
The S&P is now back to within 1.2% of its all-time highs (ATH). This is where every rally in the past 16 months has failed. It's not hard to imagine upside being limited in the near-term as the index tries to move through thick overhead resistance:
The trend for SPY is higher. SPY, including dividends (i.e., total return), made a new ATH this past week. It is above all of its moving averages, even its 5-dma. The first sign of weakness is always seen in the 5-dma, which will flatten and then turn lower. That has not yet happened.
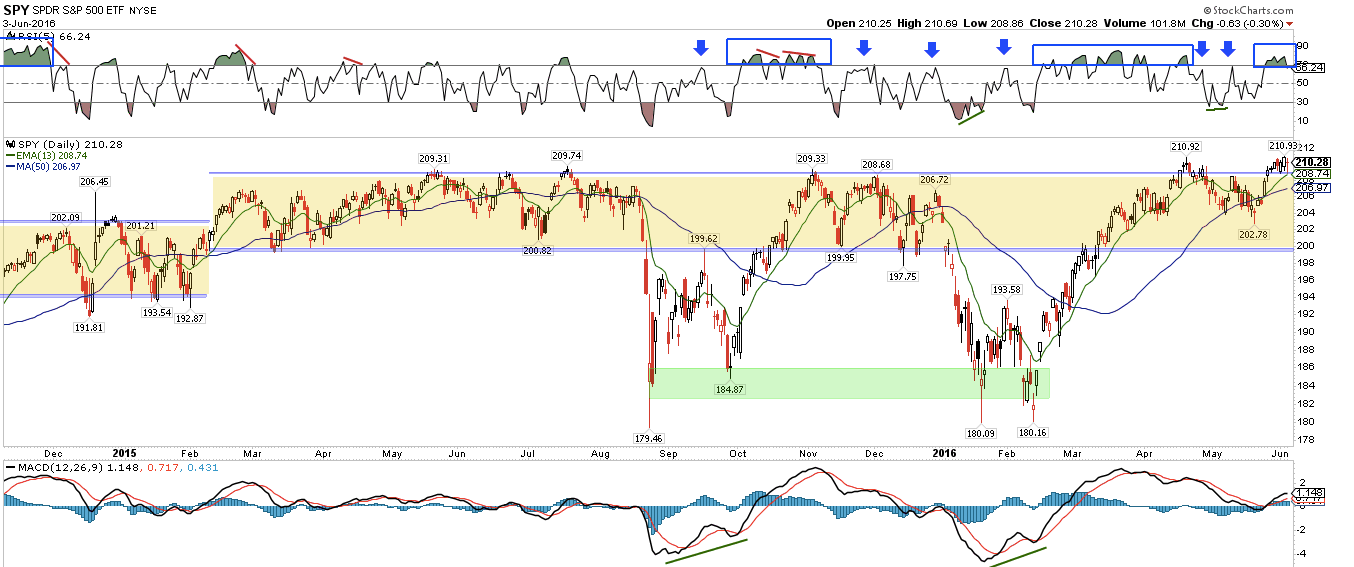
Note in the chart above that price momentum (RSI, top panel) is staying overbought. This is a sign of strength. The MACD is also rising, another positive (lower panel).
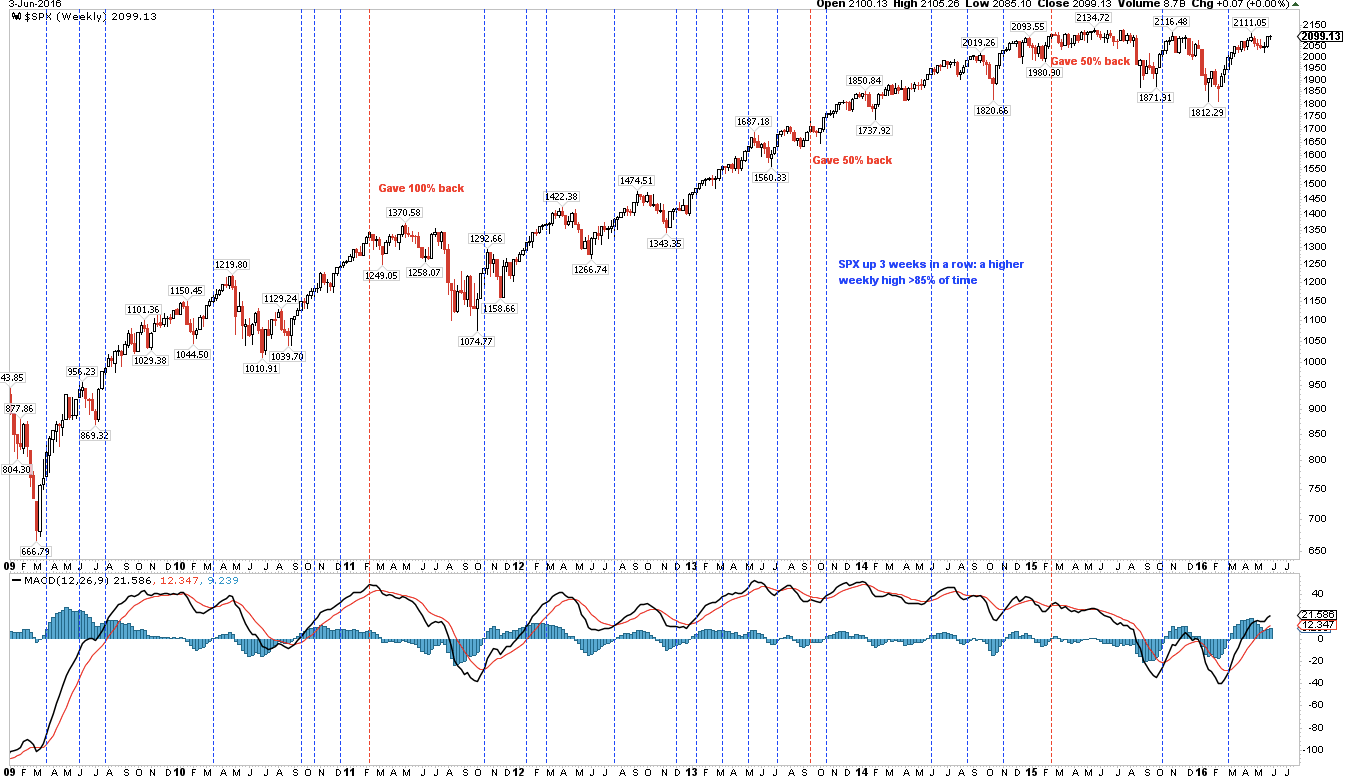
The S&P has gained 3 weeks in a row. This is also a positive indication of strength. Most often, SPX will next make a "higher high" on a weekly basis without giving much back in the interim (blue lines). Exceptions are shown in red.
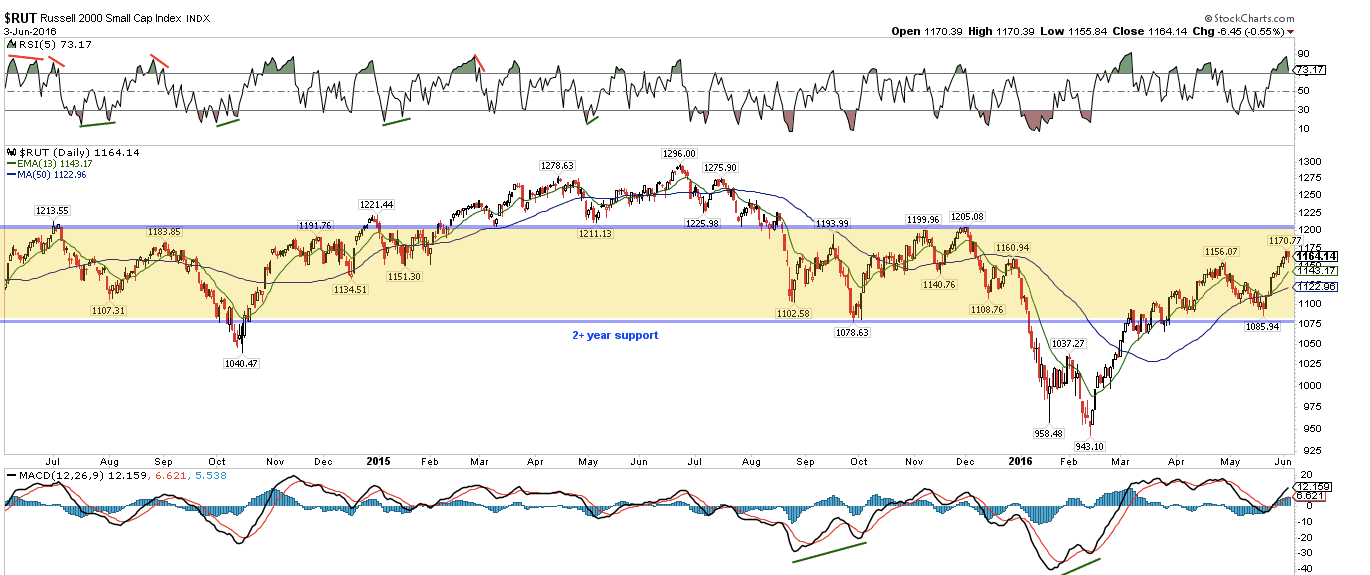
Among the other US indices, the Russell 2000 (RUT) has recently been the strongest. It gained 1.1% this week, to close at a new 6-month high, even while the other indices were treading sideways. Importantly, it has exceeded its April pivot high. Longer term, RUT remains in a 2 1/2 year horizontal channel.
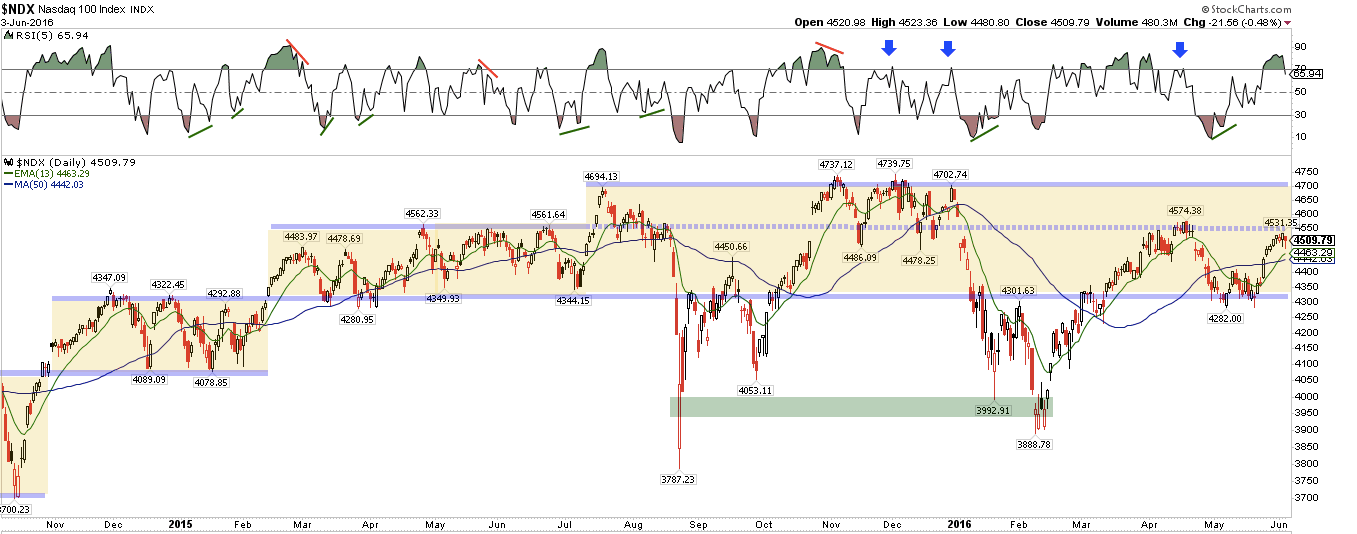
The Nasdaq 100 (NDX) is the least bullish looking index: momentum is strong (top panel) but price is below the April pivot (4550). This has been a big resistance/support level over the past year (dashed line). Should NDX close above, the index will confront supply from November/December. It's not hard to imagine the process of eating through this supply taking time.
Breadth mostly confirms the trend higher in the indices. The cumulative advance-decline in both the S&P and the NYSE made new ATHs in the past week.
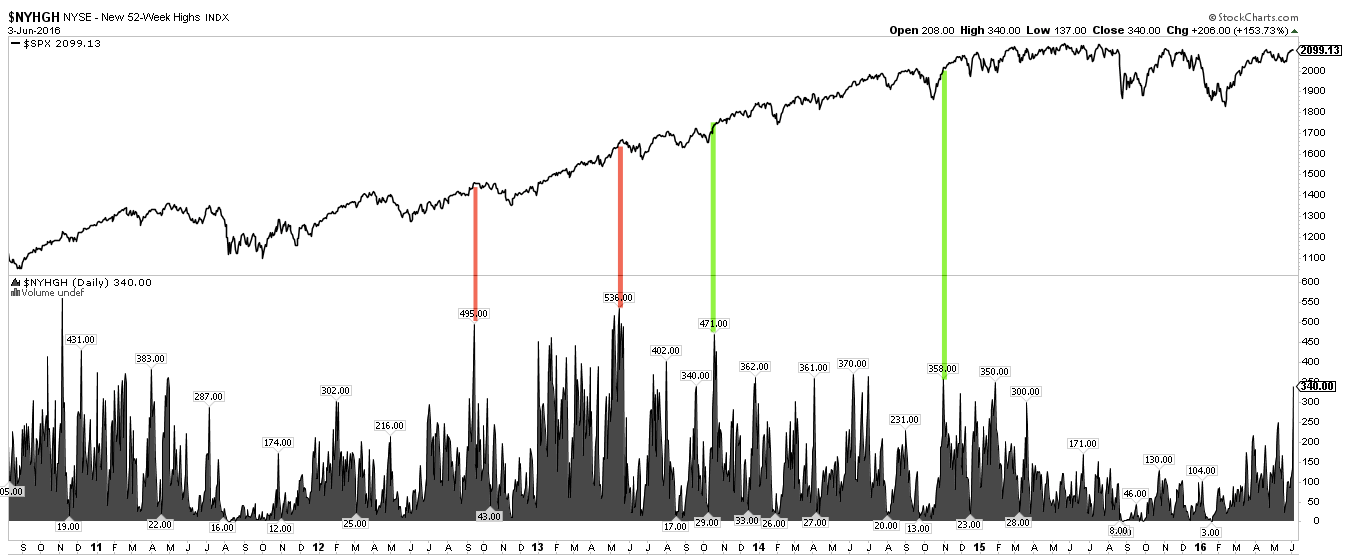
Breadth, as we have discussed before, can be challenging to interpret. While strong breadth would logically seem to be a positive, it can also mark a near-term top. The chart below is an example: new 52-week highs in the NYSE spiked higher on Friday, a sign of strength (green lines). But it can also mark exhaustion (red lines).
It's hard to recall a time when investor sentiment has been so hotly debated. One data point indicating excessive short-term bullishness is the 5-day equity-only put/call ratio (CPCE). It reached a one year low this week (lower panel). The current level has most recently marked near-term tops in SPY (top panel); if the index moved higher, those gains were slight and then given back.
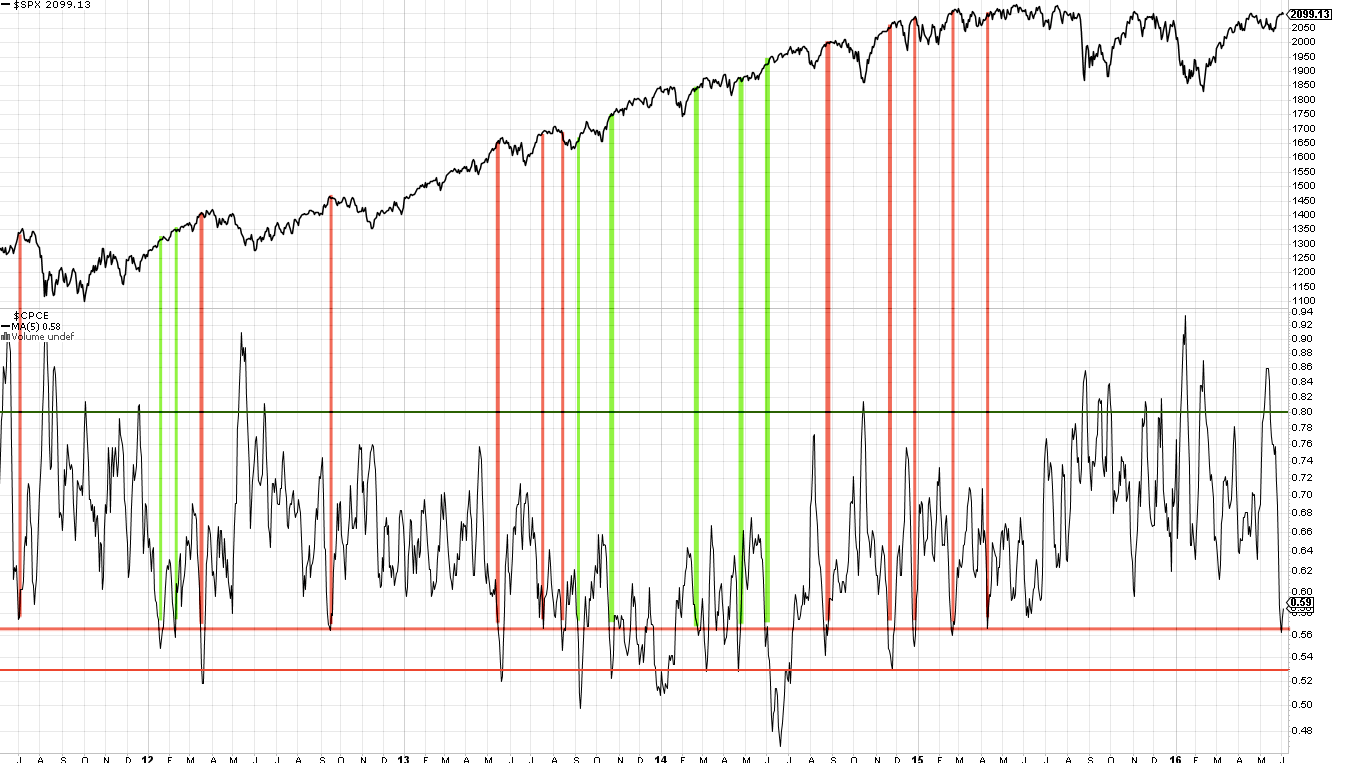
In the chart above, current CPCE levels over a longer timeframe have a less clear track record: sometimes the index declined (red lines) and sometimes it moved higher (green lines).
One explanation for this is that CPCE has been elevated over the past month. The 21-day average is not showing excessive bullishness at all (middle panel). Tops in SPY have come when 21-day CPCE was much lower (red circles). After similar instances in the past to the current one, the 5-day CPCE has trended lower as SPY moved higher (lowest panel).
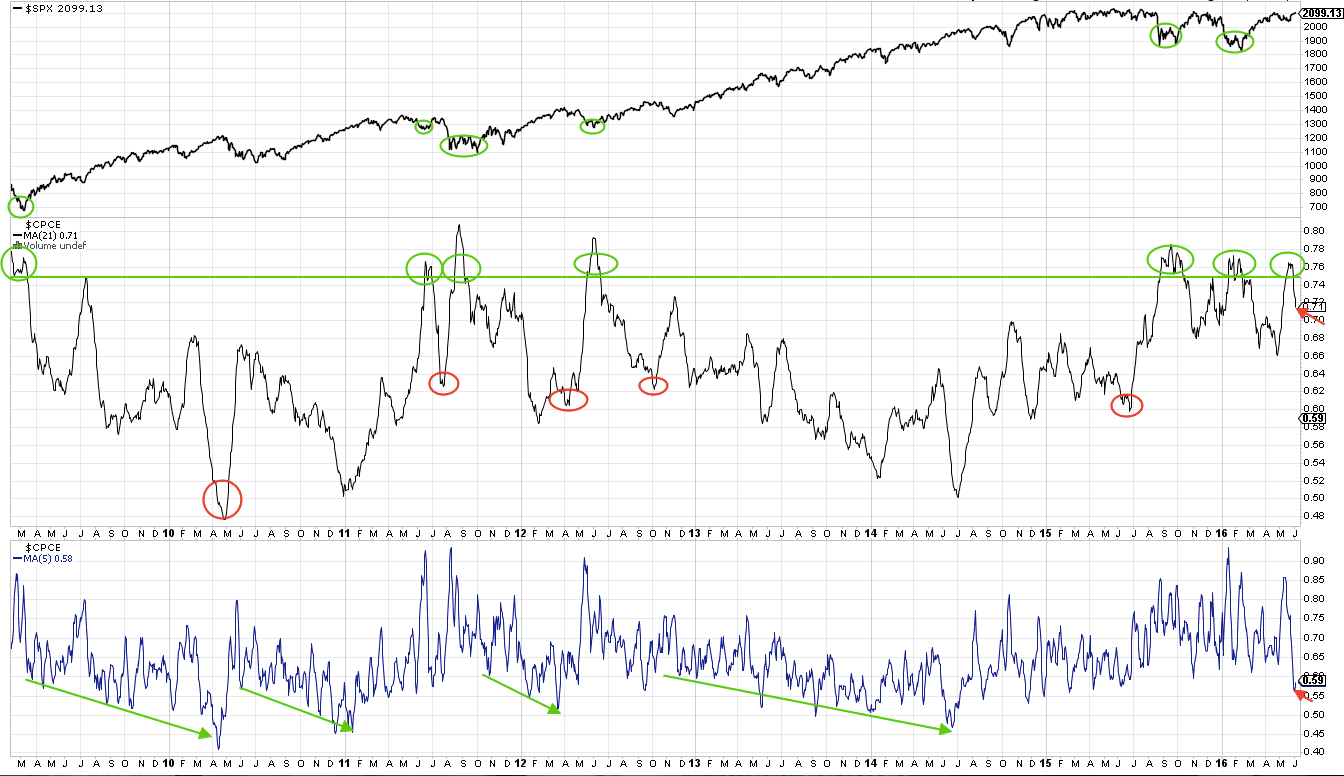
What does this imply? One possibility is that SPY works off short-term excesses before moving higher. On balance, any weakness seems most likely to be short-lived and minor.
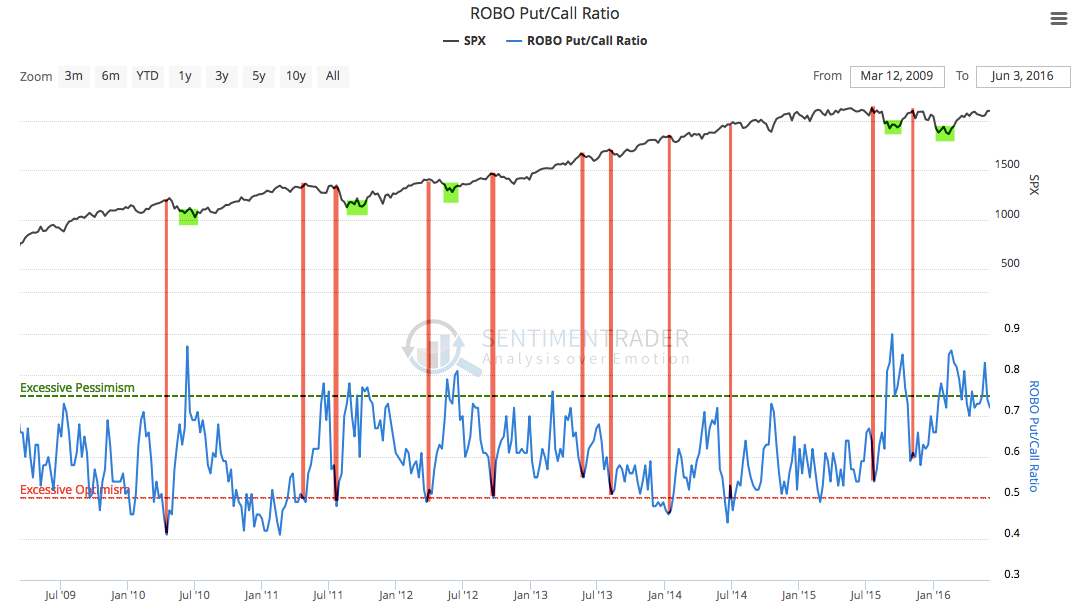
That hypothesis is confirmed by looking at small investor opening put/call transactions. This gives a cleaner view of how retail investors are getting positioned by excluding the hedging transactions of large investors. The chart below shows that retail investors remain skeptical; their relative put buying is excessive (lower panel) and this is mostly associated with higher future prices in SPY (green shading, top panel). Noteworthy near term tops in SPY have only arrived when call buying has dominated (red lines). That's not the case at present (from Sentimentrader).
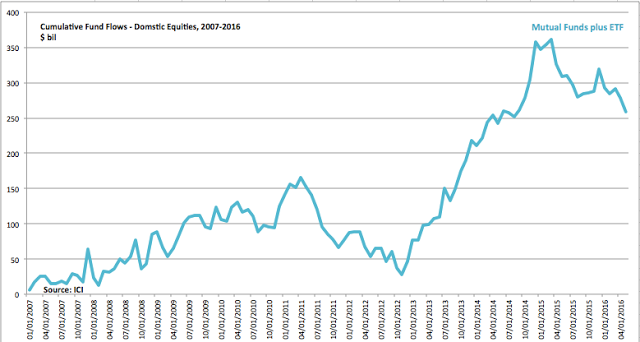
Our hypothesis is further confirmed by equity fund flows, which have been negative 18 of the past 22 weeks. In none of those 4 positive weeks were fund flows excessive. Using data from ICI (estimated through the end of May), it's clear that investors are not embracing equities, even as the S&P approaches its ATH. Should those fund flows reverse, US equities could be pushed much higher.
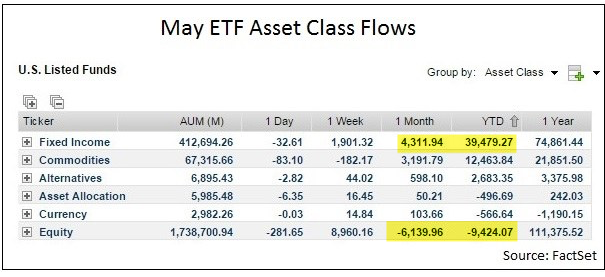
Those fund flows (which include ETFs) have gone into taxable bonds, which have been positive 18 of the past 22 weeks. Even within just ETFs, there has been a massive move to fixed income and out of equities, both YTD and in the past month (from FactSet).
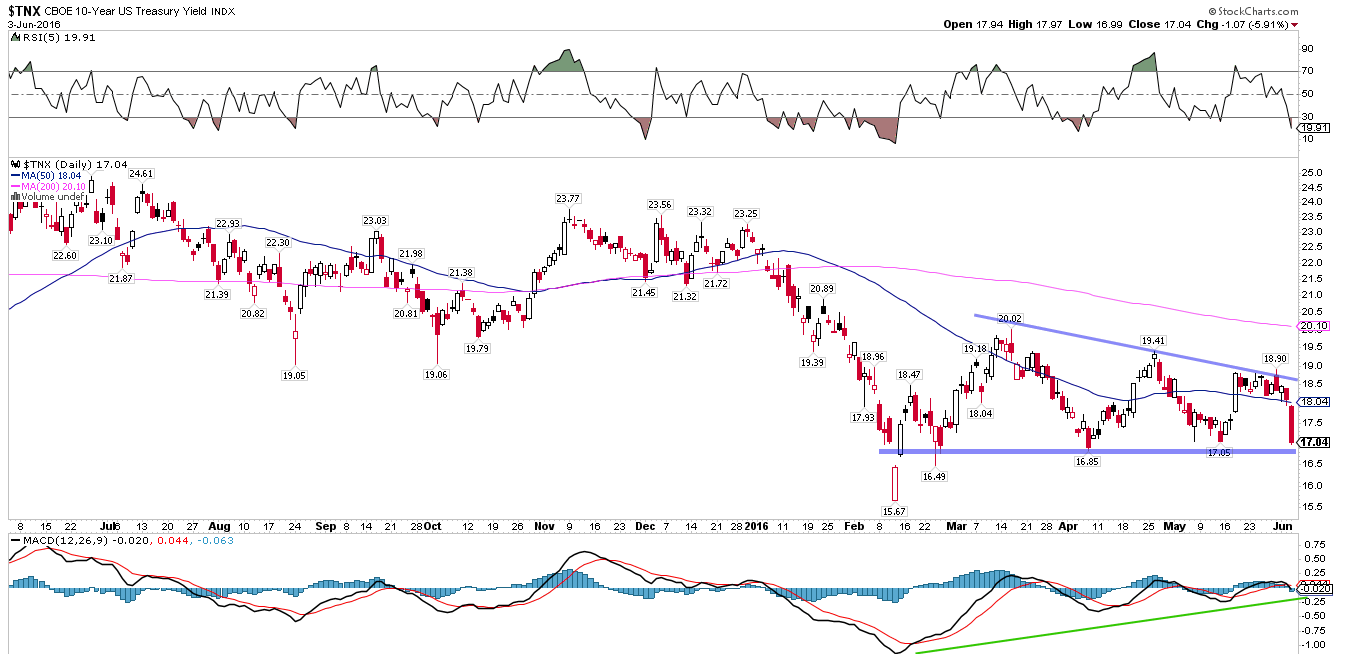
That makes the chart of 10-Year Treasuries perhaps the most important of all. Following Friday's poor NFP report, yields fell back to their lows over the past 4 months. The 50-dma (blue line) has flattened and yields are forming a descending triangle. A basing pattern could well be forming. Speculating, a reversal up through the declining top trend line would likely carry with it a reversal in fund flows, out of bonds and into equities. This is likely to be an important tell over the coming weeks.
An assessment of the recent macro data, including that poor NFP report, can be found here.
A final consideration is seasonality. The end of one month and the start of the next is typically positive for equities. That period has now passed. The middle part of the month has no strong directional bias, but can be weak (from Sentimentrader).

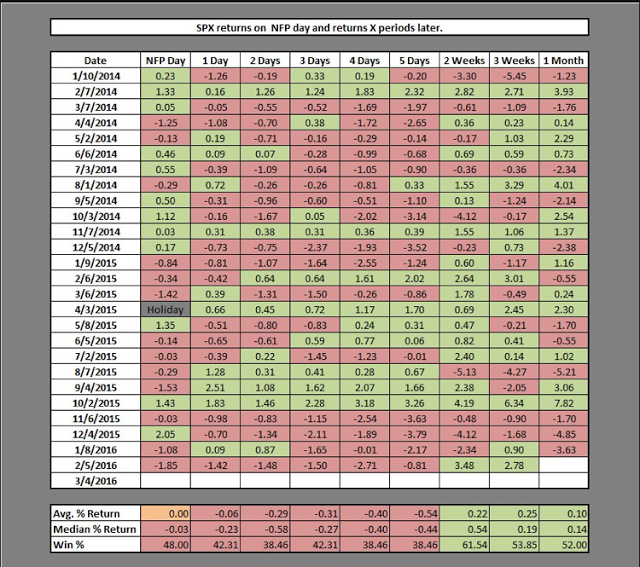
Also feeding into seasonal weakness is that the days after NFP data has been released are often weak (from Chad Gassaway).
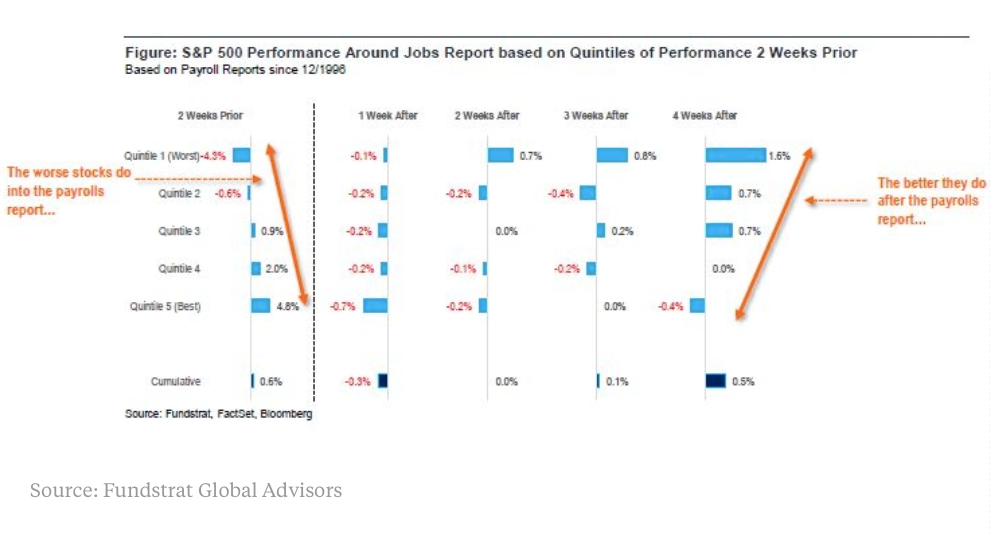
Moreover, when the S&P has rallied by more than 2% in the weeks leading into NFP, the following weeks can be soft (from Tom Lee; data updated May 2015).
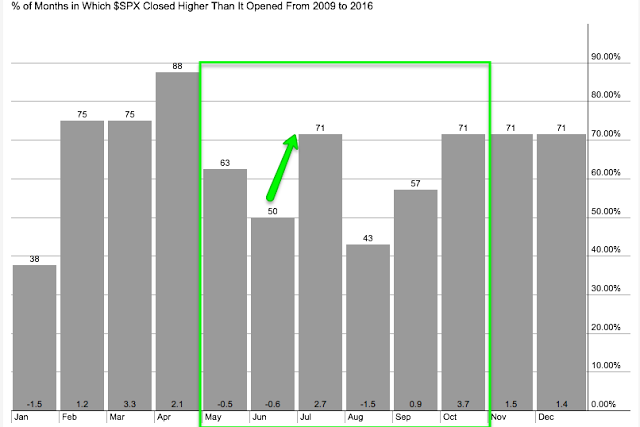
Weakness in June is not uncommon; in the past, it's been one of the weaker months of the summer. But July is one of the summer's best months for equities. This means that any short term weakness in June is likely a set up for higher prices into July.
The economic calendar is quiet this week. Janet Yellen speaks on Monday.
In summary: SPY has moved nearly 3% higher over the past two weeks. The S&P is now about 1% off where every rally in the past 16 months has faltered. Is it likely to falter now as well?
Some short-term measures of sentiment might show excessive bullishness. The seasonal pattern is also a slight headwind. Taken together, it's not hard to imagine upside being limited in the near term.
But longer-term measures of sentiment, especially fund flows, suggest that further gains are still ahead. This means that any short term weakness is a set-up for higher prices into summer.
