Summary: After gaining 16% from the February low, the S&P 500 has been trading in a 2% range during May. A minor 20% of the rally has been retraced, a sign of resilience and consolidation. Despite the recent rally, investors are positioned for weakness, not further gains. There might still be a capitulation low ahead but the set-up is for higher prices in the next month(s). End of May and start of June seasonality are possible short-term tailwinds for equities.
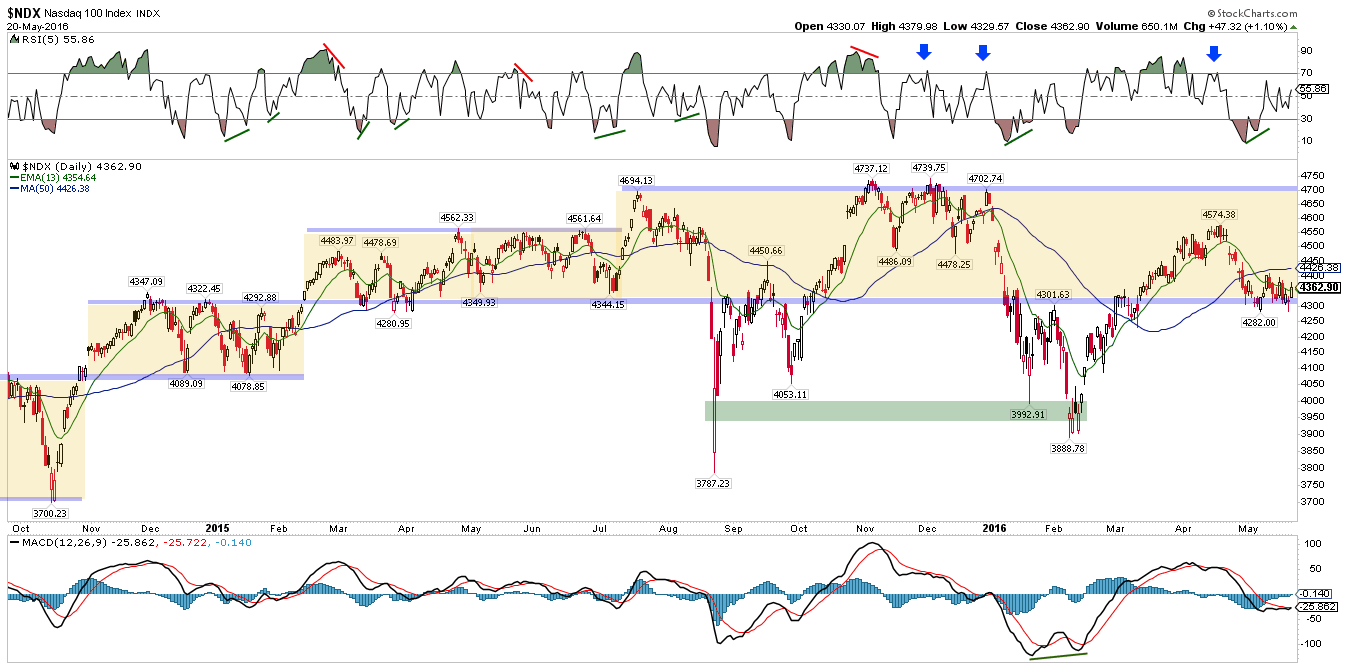
The main watch out is the NASDAQ 100 (NDX): a key support level has been tested twice, including on Thursday of this past week: if it is breached, the index has the potential to fall 5-10% lower into the 'hot mess' from summer 2015 and winter 2016.
In our last market summary three weeks ago, the near term trend had turned weak and the set-up was for the SPDR S&P 500 Fund (NYSE:SPY) to move to its 50-dma and lower Bollinger® Band. There was little reason to expect more significant weakness as breadth, sentiment, macro, commodities and seasonality were generally supportive.
In the event, SPY visited its 50-dma the following week and then revisited that same level again this past week. During this time, SPY has lost about 1% and remained within a tight 2% range for the past 3 weeks.
To put that in perspective, SPY rallied 16% from its February low to its late April high, and then retraced just 20% of that rally. This is, overall, very minor and a sign of resilience after recording strong gains.
The weakest index in the US has recently been the NDX. It might be the best barometer for what happens next. NDX formed an important low on May 6 (4300 level) and then retested that low this week. Should that low be breached, NDX will be back into the hot mess from August/September 2015 and January/February 2016, with the potential to "waterfall" 5-10% lower once again.
SPY is a bit better than NDX. The near term trend is still weak: daily RSI(5) is under 50 (meaning poor momentum; top panel), the MACD is still declining (bottom panel) and, most importantly, price is under a declining 13-ema. Thursday's rebound, with follow through on Friday, looks promising, but those gains must be added to early this coming week. A return to 204 likely leads to bigger support near 200, 2% lower.
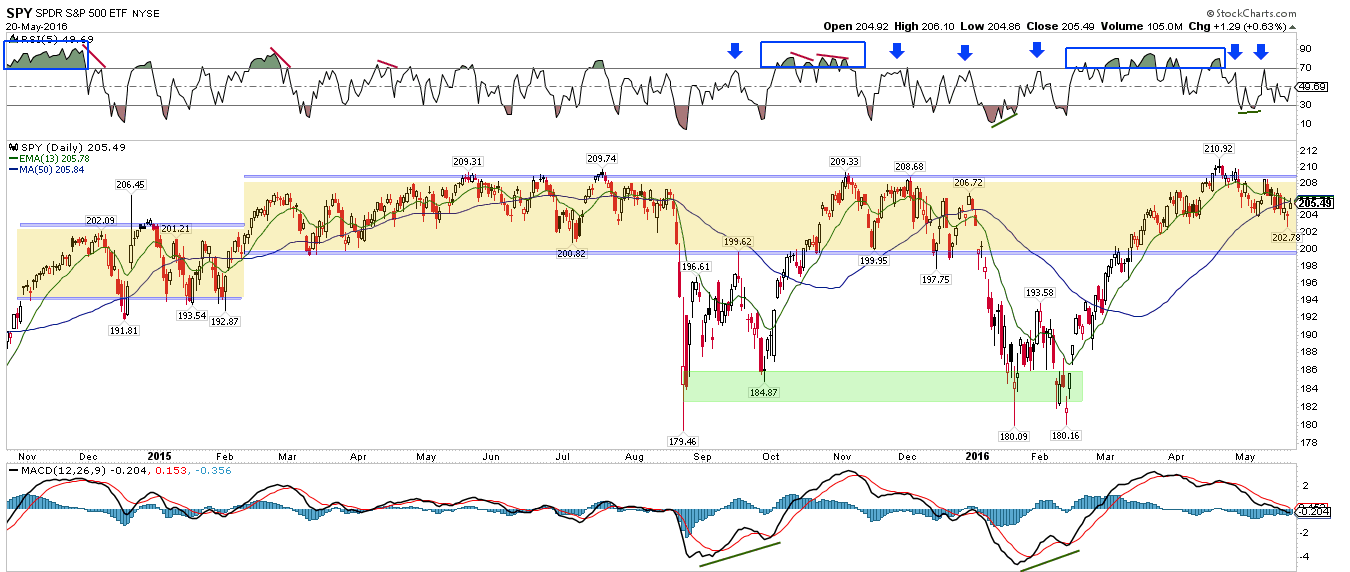
As the chart above shows, SPY is in the middle of a trading range that has existed since the start of 2015. There has been little net gain. Why? Partly due to fundamentals: sales and profits for the S&P peaked at the end of 2014 and have declined since then. Valuations at the end of 2014 and even at present are near the highs of the prior bull market. A detailed post on this from last week is here.
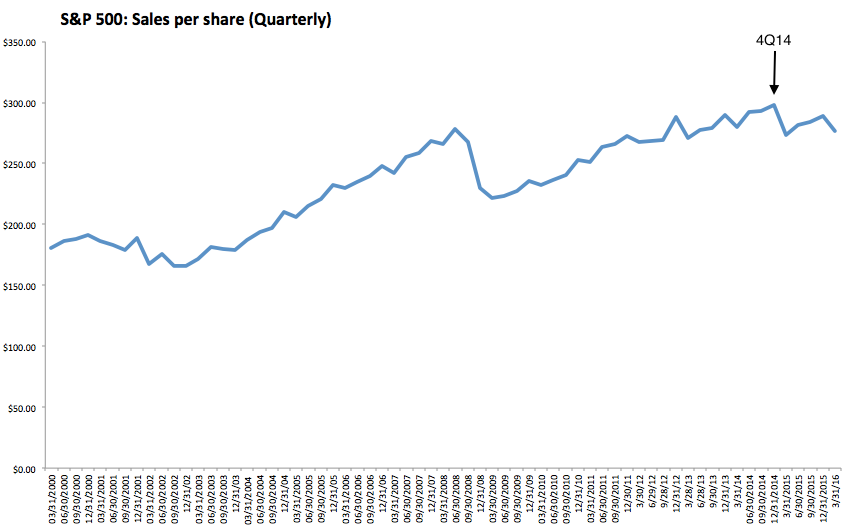
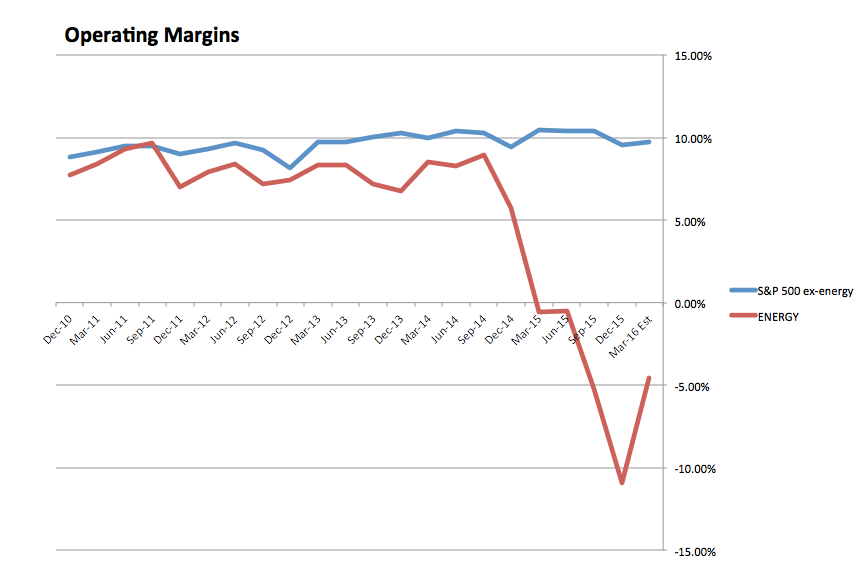
Importantly, the decline in sales and profits corresponds with both the start of a 75% drop in the price of energy as well as the start of a 20% appreciation in the dollar. The year-over-year impact from both is likely to become minor (or possibly a tailwind) during the course of 2016. Note: margins outside of energy are unchanged since the end of 2014.
If your view is that falling energy significantly boosted the sales and profits of other sectors, or that energy is similar to banking in 2007, then you can read further at last week's post, linked above.
Another, equally important, change has taken place since the end of 2014. Heading into 2015, expectations were for equities to appreciate another 10%. Retail and professional investors were bullish to a near historic degree. This was a headwind to price appreciation which we wrote about several times in late 2014: read two of those posts here and here.
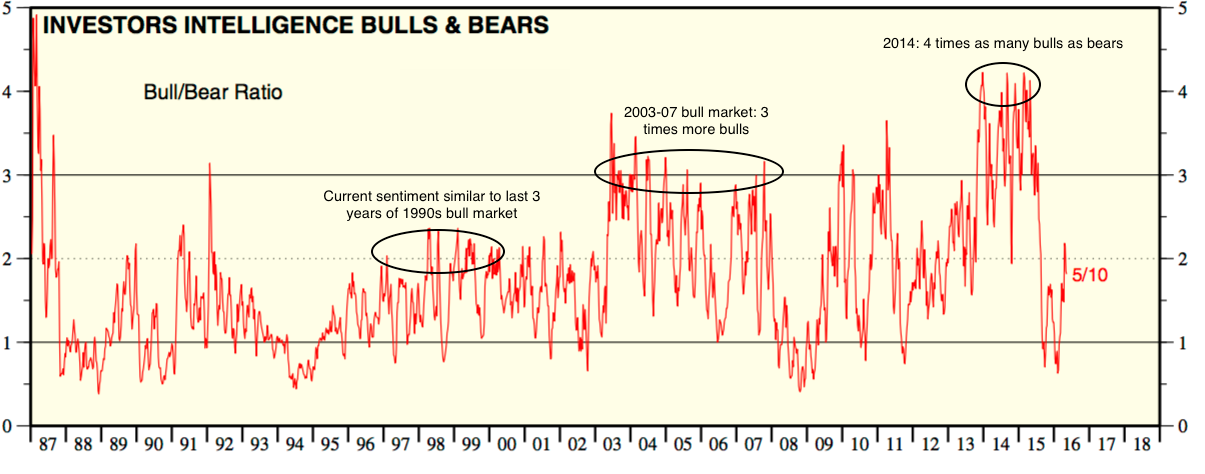
What is remarkable now is that price is virtually unchanged since the end of 2014, yet bullish investor sentiment has been largely unwound. The chart above is an example using survey data from Investors Intelligence.
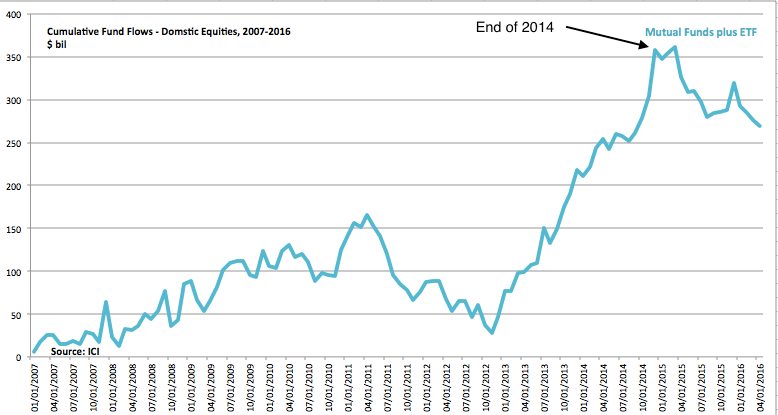
Since the end of 2014, investors have been net sellers of domestic equity mutual funds and ETFs. SPX is less than 4% from its all-time high, yet cumulative fund flows are more than 25% lower than 18 months ago. Investors are clearly not betting on further gains in equities.
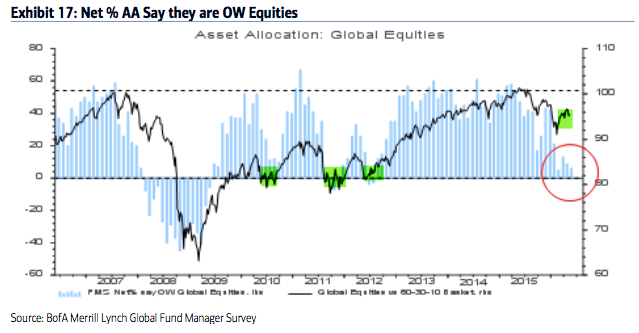
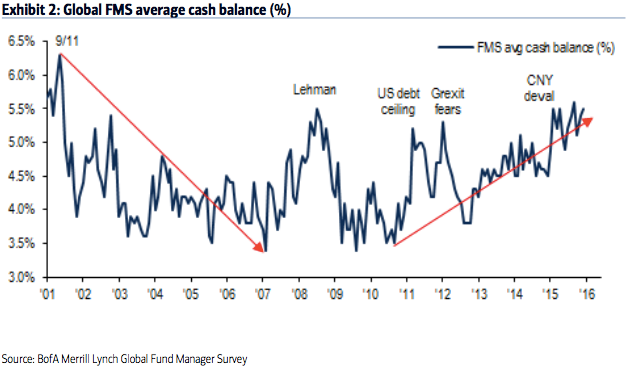
Similarly, the equity allocation of professional fund managers at the end of 2014 was equal to that at the market peak in 2007. That has since been completely unwound: equity allocations are now at the same levels as at market troughs in mid-2010, 2011 and 2012. Despite the 16% rally, cash levels are as high as in February and near all-time highs.
US equity allocations are near an 8-year low. Read more in a post from this week here (charts from BAML).
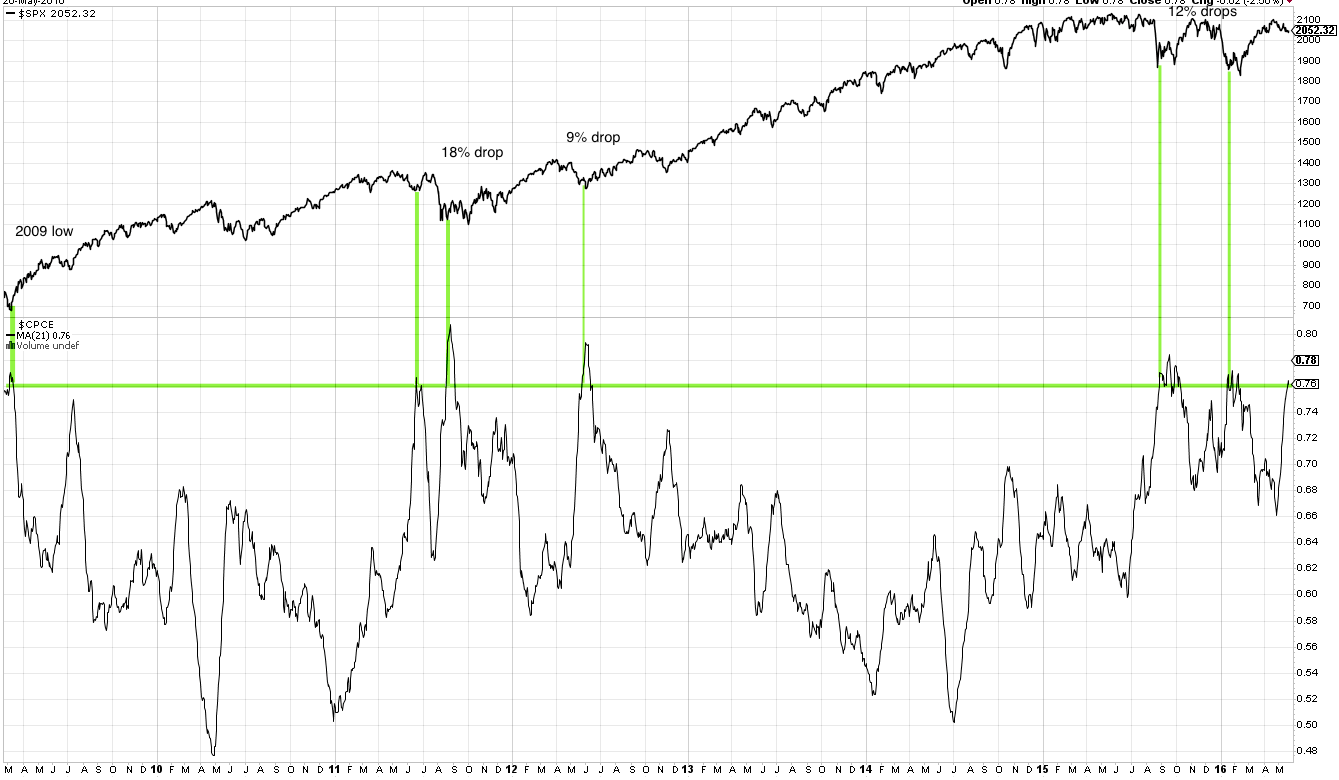
Finally, the equity-only put/call ratio over the past month is equivalent to that near the equity lows in 2009, 2011, 2012, 2015 and in February of this year. That's particularly impressive since equities fell by 10% or more in each of those cases, yet SPX is now barely 2% lower than at its April peak.
Is the fact that the SPX has failed to make a new high in the past year necessarily bearish? No. The same situation existed in 1995, right before the most explosive part of the 1990s bull market. According to Sentimentrader, the current situation - a tight range for a year without a new ATH - has preceded the indices moving higher in the next year in 5 out of the 6 times that it has occurred (chart from Dana Lyons).
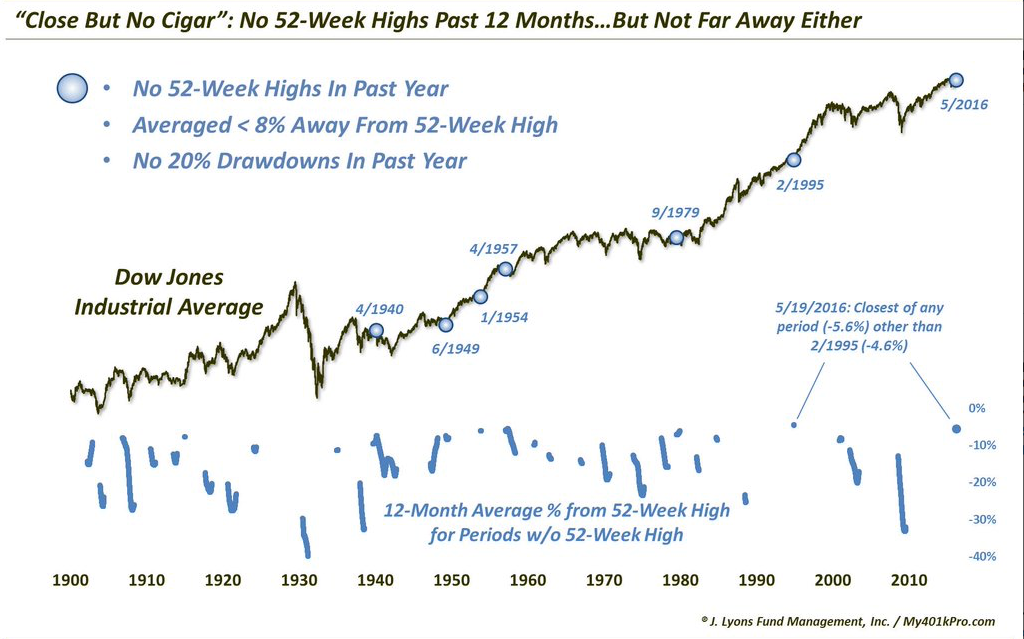
So, while SPY may have failed to produce any net gains since the start of 2015, the set-up now is not at all the same as then. The headwinds from energy and the dollar will probably become minor during 2016 and investors are mostly positioned for further weakness, not gains. There might still be a capitulation low ahead but the set up is for higher prices in the next months.
It's also worth remembering that into the April high, SPX had made a "higher low" for 10 weeks in a row. Since 1954 (62 years), this has happened only 13 other times. What happened next? In every case, SPX had a higher weekly close within the next 2 months. At the end of 2 months, 85% of these cases closed higher. This supports our lead hypothesis that the market is most likely in the process of digesting its prior gains before moving higher during the late-Spring or Summer.
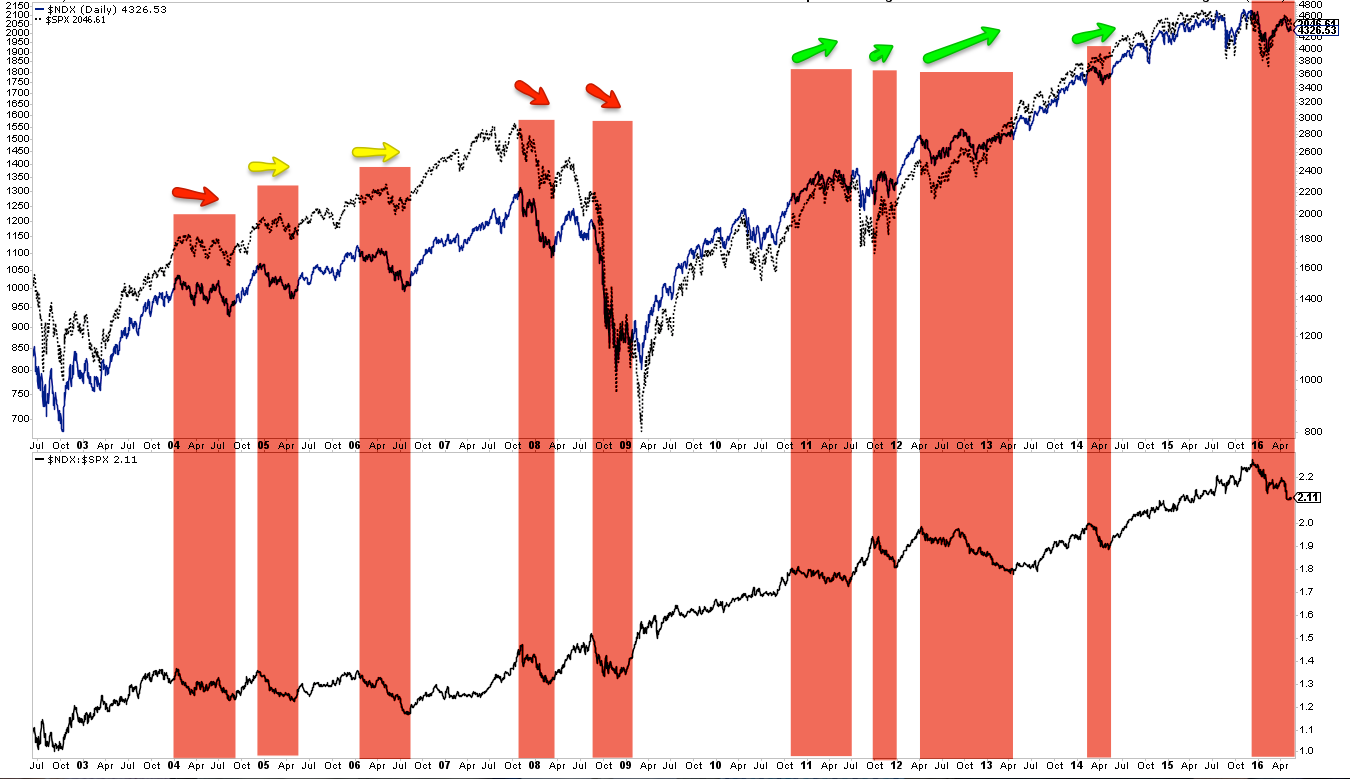
The NDX has recently lagged the SPX; is this necessarily bearish? No. Since 2004, this has happened at least 9 other times and in half of those situations, SPX moved higher (green arrows).
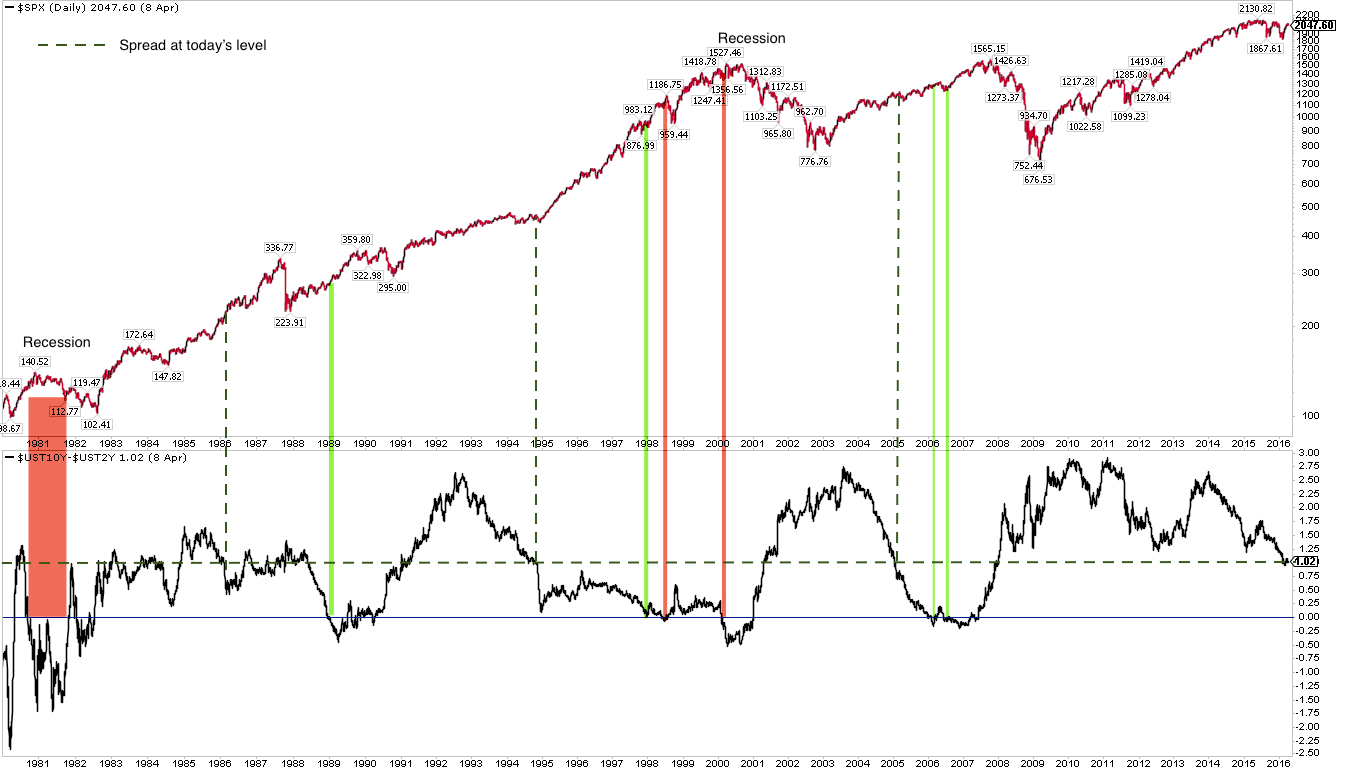
The yield curve (the difference between the yield on 10- and 2-Year Treasuries) has been flattening. This means that investors see declining growth prospects. Is this necessarily bearish?
The answer is no. The current spread in yields is equivalent to 1986, 1995 and 2005: the SPX was in the process of moving higher each time (dashed lines). An inverted yield curve (where the 10-year yields less than the 2-year) has happened at least 7 times in the past 35 years. In only two of those cases did the economy soon slide into a recession (1981 and 2001; red lines). Most of the time, SPX moved higher and the next recession was still a way off (green lines).
A recent and well-reasoned article on the yield curve can be found here.
No significant changes in breadth have taken place since the end of April. SPX is 2% below its late April peak and the cumulative advance-decline line for SPX is also 2% lower. There is no new signal from breadth. Recall that the A-D line for SPX made a new high in April.
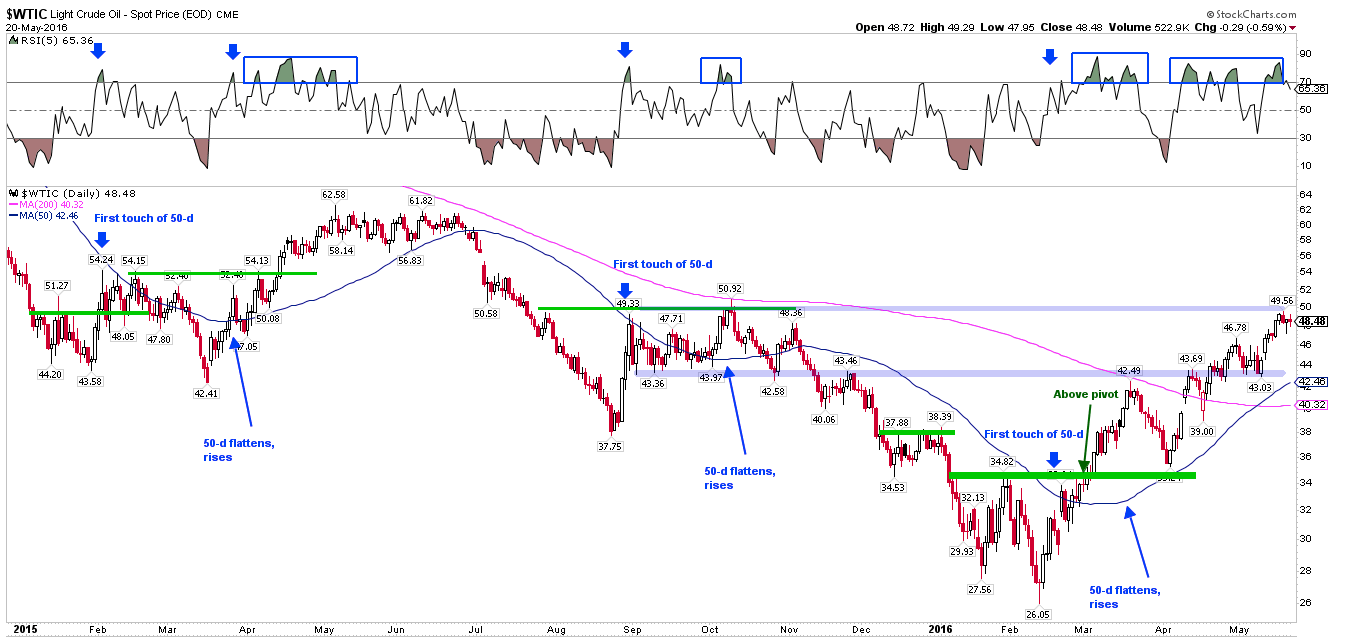
This week, crude made an 8-month high. Momentum remains good (top panel). A strong trend will stay overbought, something to keep watching. Price has now reached the $50 target resistance level mentioned in past posts.
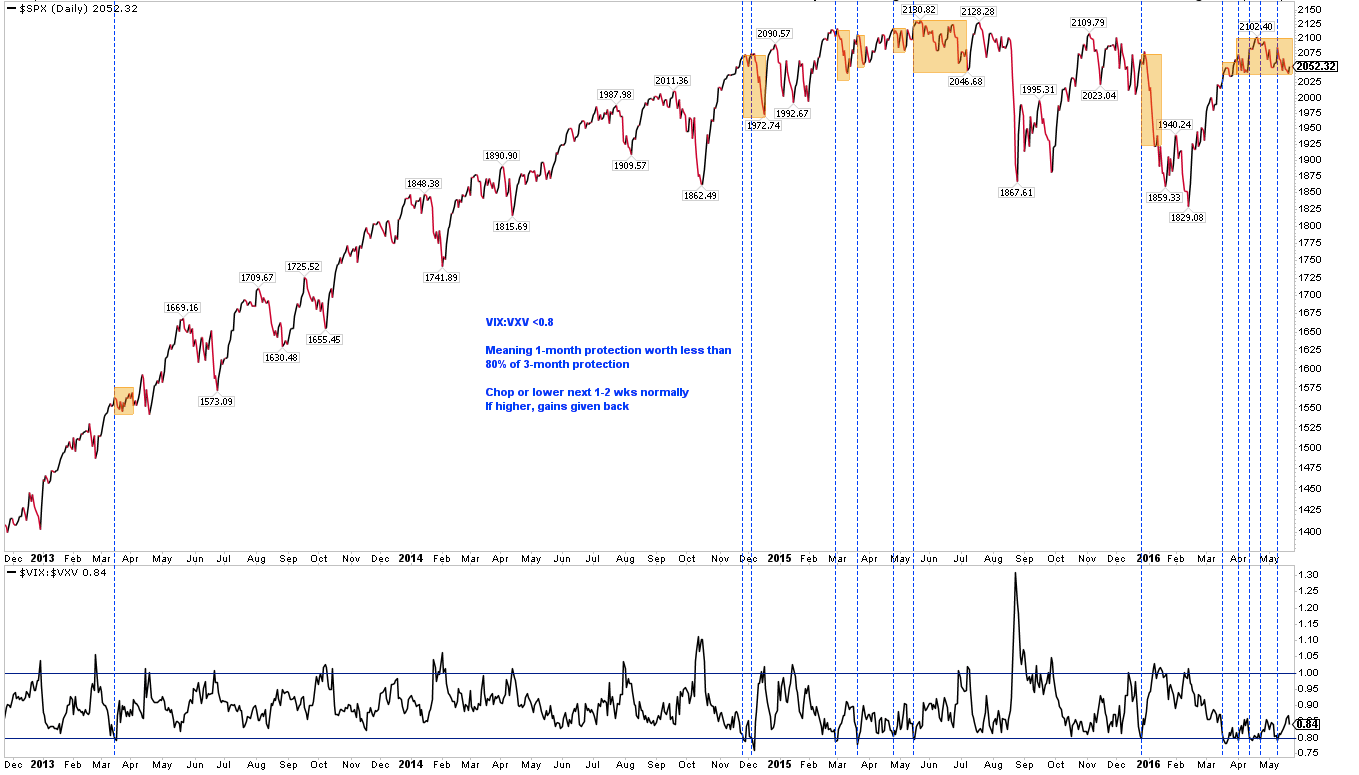
Finally, one of the reasons for expecting weakness in May was the term structure of volatility (via VIX, VXV). When 1-month protection is worth less than 80% of 3-month protection, the rally in SPX reverses; if it continues higher, those gains are then given back. That 80% level had been reached 5 times between late March and early May. All gains since the first signal have been given back. This is now neutral.
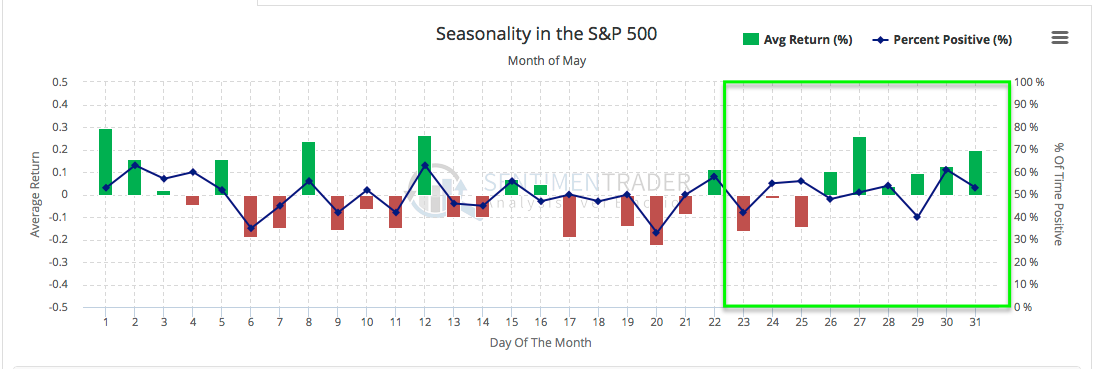
The end of May, starting on the Thursday before the Memorial Day weekend, typically has a positive seasonal bias (first chart) that carries through the first week of June (second chart). Seasonality is possible short-term tailwind (from Sentimentrader).
On the economic calendar is new homes sales (Wednesday), durable goods orders (Thursday) and GDP (Friday).
In summary: after gaining 16% from the February low, SPX has been trading in a 2% range during May. A minor 20% of the rally has been retraced, a sign of resilience and consolidation. Despite the recent rally, investors are positioned for weakness, not further gains. There might still be a capitulation low ahead, but the set up is for higher prices in the next month(s). End of May and start of June seasonality are possible short-term tailwind for equities.
The main watch out is NDX: a key support level has been tested twice, including on Thursday of this past week: if it is breached, the index has the potential to fall 5-10% lower into the 'hot mess' from summer 2015 and winter 2016.

