Summary: Equities rose 3% for their third weekly gain in a row, led by small caps and further gains in oil. The SPDR S&P 500 ETF (NYSE:SPY) has now rallied 10%, back to a level that was major support throughout most of 2015. It would be easy to say that the rally ends here, but strong breadth, persistent investor pessimism and strength in other asset classes suggest that further upside ultimately lies ahead. That said, by the end of the week, the advance showed several signs of being overextended; weakness early next week would be normal. In fact, if equities continue with an uncorrected rally, those gains are likely to be given back in the weeks ahead.
Equities continued to rally for the third week in a row. For the week, SPY gained 2.7% and NDX gained 2.2%. RUT again led to the upside, gaining 4.3%, making this a broad-based rally.
Safe havens - Treasuries and gold - which had been in high demand during the sell off in equities, were split: Treasuries lost 1% for its third weekly loss in a row, while gold rose 3% after falling the prior two weeks.
Oil gained another 10% this week. It's leading to the upside.
It's easy to forget, but the correlation between asset classes remains very high, with the common denominator being the price of oil. Oil bottomed on February 11, the exact same day equities, high-yield bonds and treasury yields all bottomed. Until Thursday, that day also marked the high point for gold.
The implication is that for the rally in equities to continue, the price of oil has to also rise, or at least stabilize. We'll review other indictors, but it's likely these will make little difference if oil starts to fall. It's the single biggest wild card facing all of these markets in the weeks ahead (enlarge any chart by clicking on it).
The rally in SPY has brought it to a key resistance area. 200-201 was a major support area for most of 2015 (yellow shading). This should be resistance going into next week: it took several tries to close above this area last October. Note the fall back to the rising 13-ema (green line) before SPY eventually succeeded in regaining 201 for good in October. That is a scenario to watch for next week.
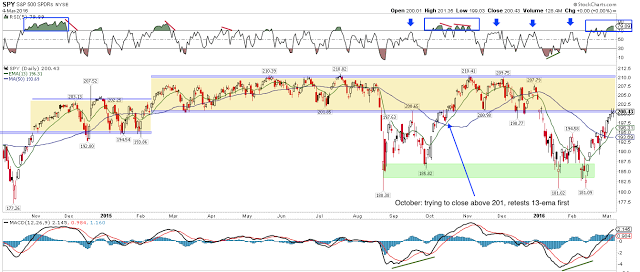
That momentum remained "overbought" was one of the positive indications that we have been looking for as a sign that the rally will continue higher (top panel in the chart above; boxes). So far, so good.
On a shorter timeframe (hourly), SPY has (1) held above its rising 5-dma (green line) and (2) remained mostly "overbought" (top panel). This uptrend is not showing signs of weakening, but it has clearly reached a strong level of resistance (blue arrows).
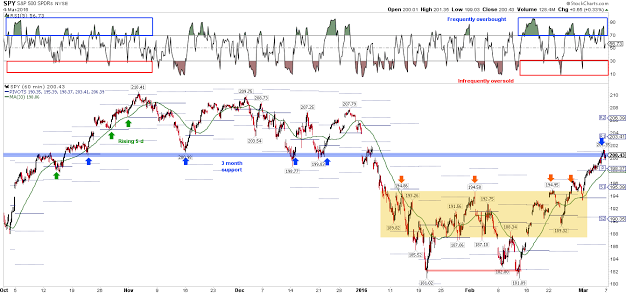
In the chart above, SPY normally checks in with its rising 5-dma every few days. Note the green arrows from last October on the left side as an example. That test is now well-overdue. More likely than not, SPY will meet its 5-dma early next week (currently at 198).
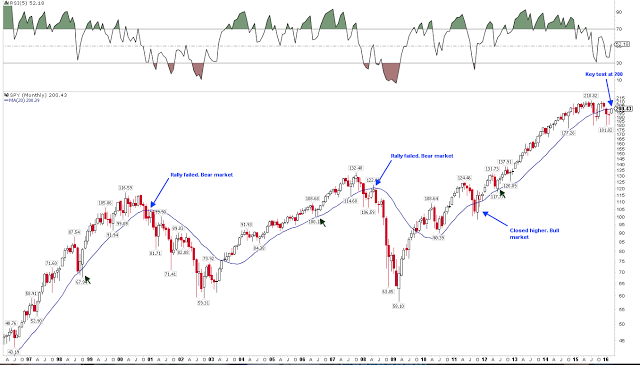
On a longer timeframe (monthly), the importance of this week's high becomes more apparent. Recall that in the past two bear markets, a rally that fails to close back above the monthly 20-ma (blue line) has led to a deep contraction. That makes 200 a critical watch out area for the current rally. If past is prologue, a close below at the end of March will be bearish, a close above bullish.
In the discussion above, we noted the likelihood of SPY testing it's shorter term moving averages (5-dma and 13-ema). A further reason to expect that to happen in the next few days is breadth.
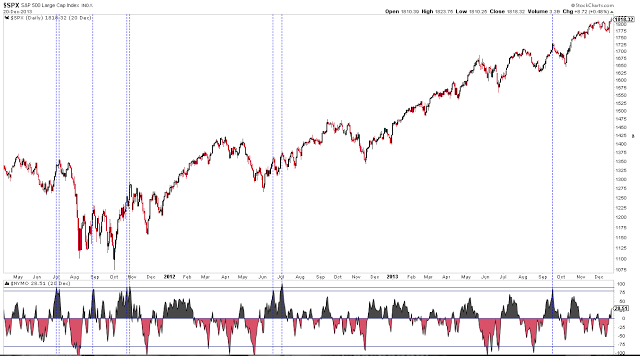
The McClellan oscillator, NYMO, closed above 90 four days in a row this past week. Going back to 1998, this is the first time this has ever happened. We reviewed this indicator this past week, with the conclusion that if the indices continued higher in the days ahead, then those gains would likely be given back. That implies a fall back to at least 198 on SPY. This level corresponds neatly with the shorter term moving averages.
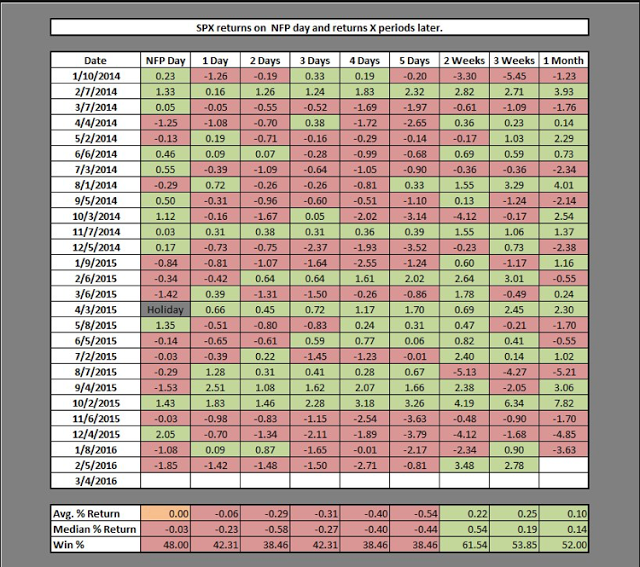
Weakness has also mostly been the pattern after the release of the monthly employment report (NFP). In 85% of instances over the past two years, SPY closed lower at some point during the next week (from Chad Gassaway).
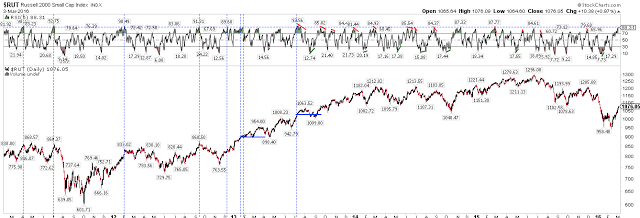
A further reason to expect some weakness this coming week is that momentum is too strong. Momentum in small caps this week reached its highest level since July 2013 (top panel). In the past five years, whenever momentum has been this strong, the index has retraced. If the index continues higher, all subsequent gains will likely be given back (vertical lines).
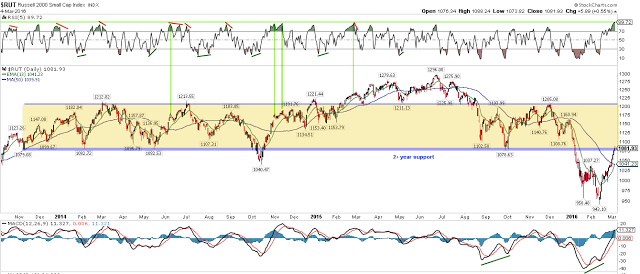
That small caps are likely to retrace some gains this coming week is made more likely by the fact that price ended Friday at the most significant support/resistance level over the past two years.
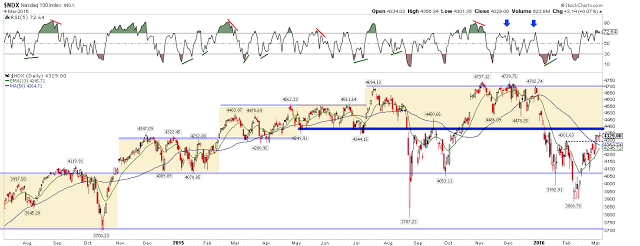
While its momentum is less "overbought" than for small caps, NDX is also within 1% of a significant support/resistance level from the past year.
After a 10% gain since the low, and with SPY (as well as RUT and NDX) sitting at resistance, it would be easy to say that the uptrend is over. But there are three reasons to believe that further gains are likely still ahead.
The first is that extreme investor pessimism persists. There was another $2.4b outflow from equity funds this week. Equity fund flows have been negative 13 of the past 14 weeks, longer than any time during the 2007-09 bear market. Meanwhile, investors have added to the safe haven of bonds, with a further $2b inflow this week. Those flows have been positive 12 weeks in a row.
These flows suggest that there is very little fear of missing out (FOMO) in this rally. We would expect some improvement in investor sentiment before this rally ends. The bear market rally in March-May 2008 included several positive weeks of equity inflows, including one that was more than $20b in one week. Until there is some sign of FOMO, further upside seems likely (a chart on fund flows is here).
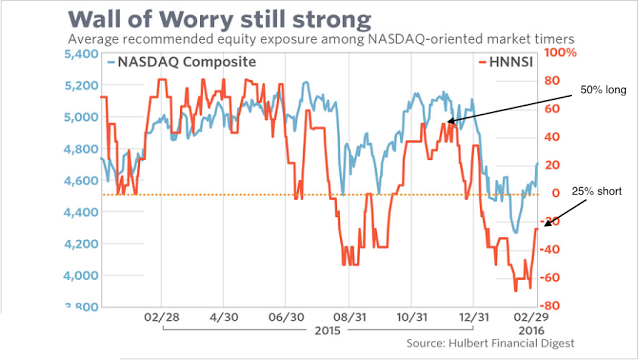
Similarly, market timers in the NASDAQ are still 25% short the index, even after the strong rally. In contrast, the rally last October started to fail when these market timers were 50% long (orange line). Extreme pessimism in the face of a rally usually leads to further upside (from Mark Hulbert; the full post is here).
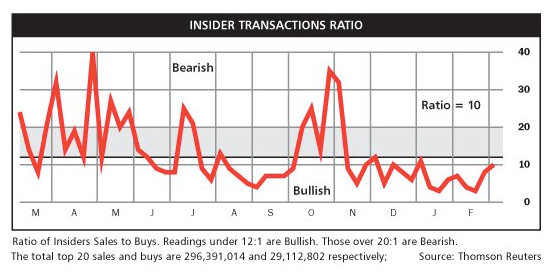
Moreover, company insiders rushed to sell the rally in October. This time they haven't. This usually indicates further upside. Insiders aren't always right - no one is - but their timing has tended to be very good (from Barron's).
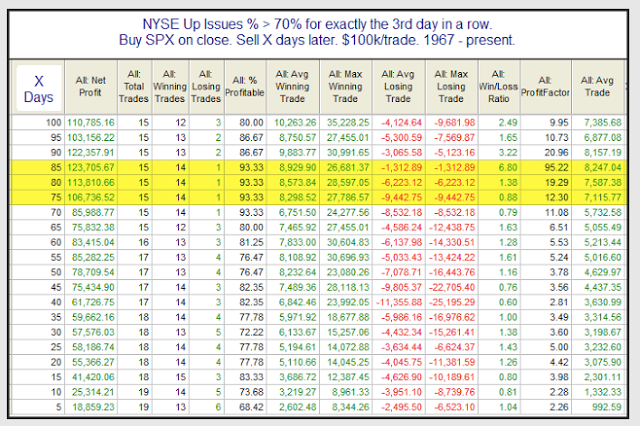
The second reason to expect more upside is the strength in breath. More than 70% of the issues on the NYSE advanced the last four days in a row. After similar cases in the past, SPX was higher 3 weeks later over 80% of the time. This is the second time we have seen this occur in the past two weeks (from Rob Hanna; his post is here).
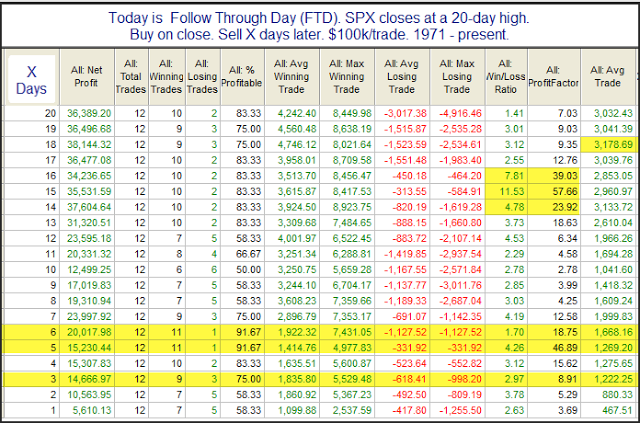
Moreover, Tuesday was a follow through day (FTD) that occurred at a new 20-day high in SPY. 92% of similar cases were higher a week later and 84% were higher 3 weeks later (from Rob Hanna; his post is here).
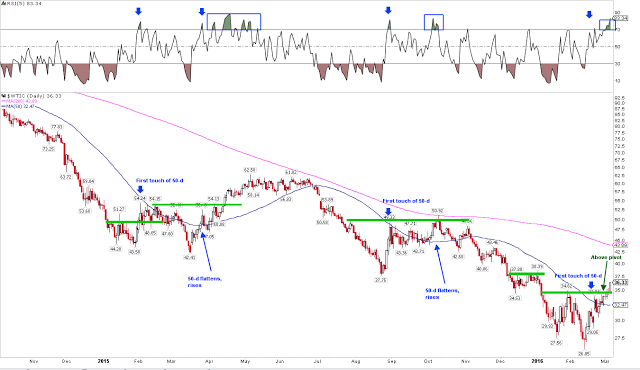
Thirdly, other asset classes are, for the time being, confirming the move higher in US equities. Crude has rallied back above its 50-dma, has pushed through the pivot (green line at $35) and is staying overbought (top panel). This is very constructive.
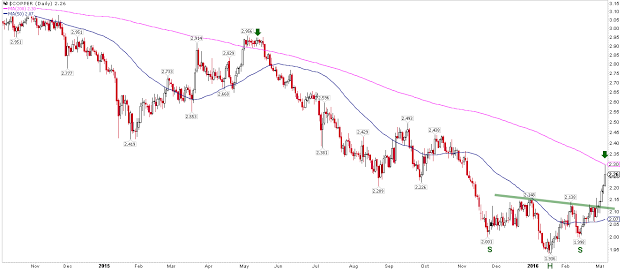
The price of other commodities is also improving. Copper traded at a 4-month high this past week, gaining 7%. This might be indicating better global manufacturing demand. Note that the rally last spring ended at copper's 200-dma, a watch out for next week (pink line; arrows).
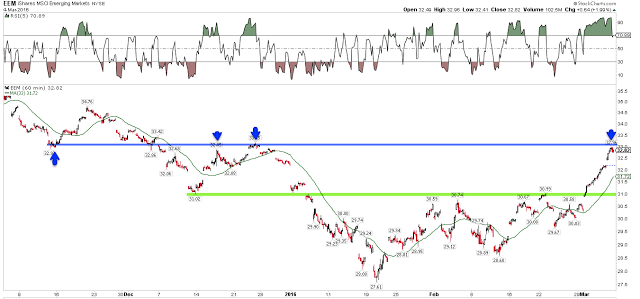
Better commodity prices is helping push emerging markets (via iShares MSCI Emerging Markets (NYSE:EEM)) higher. For the week, they gained 10%. That rally is now at a former resistance area. The torrid pace of gains the past 4 days is also in need of a rest.
The economic calendar is empty this week.
In summary, equities rose 3% for their third weekly gain in a row, led by small caps and further gains in oil. SPY has now rallied 10%, back to a level that was major support throughout most of 2015. It would be easy to say that the rally ends here, but strong breadth, persistent investor pessimism and strength in other asset classes suggest that further upside ultimately lies ahead. That said, by the end of the week, the advance showed several signs of being overextended; weakness early next week would be normal. In fact, if equities continue with an uncorrected rally, those gains are likely to be given back in the weeks ahead.
