REVIEW
Quite a volatile week. The market started at SPX 1983 on Monday, gapped down to open the week, rallied back to slightly above 1983 on Tuesday, then declined, without any gap downs, to 1926 by midday Thursday. Then the market rallied, with a gap up opening on Friday, and still ended the week lower. For the week the SPX/Dow were -0.7%, the NDX/NAZ were -0.7%, and the DJ World index lost 2.0% again. On the economic front there was good news and not so good news. On the uptick: personal income/spending, the PCE, the ADP, monthly payrolls; plus the unemployment rate, weekly jobless claims and trade deficit all improved. On the downtick: pending home sales, construction spending, Case-Shiller, the Chicago PMI, ISM manufacturing/services, factory orders, the WLEI and the monetary base. Next week we get the FOMC minutes, export/import prices and consumer credit.
LONG TERM: bull market
The five Primary wave Cycle wave [1] bull market from March 2009 continues to unfold. We have counted Primary waves I and II completing in 2011, and it appears Primary III recently completed in September. Primary I divided into five Major waves, with a subdividing Major 1 and simple Major waves 3 and 5. Primary III also divided into five Major waves, but Major 1 was simple and Majors 3 and 5 subdivided.
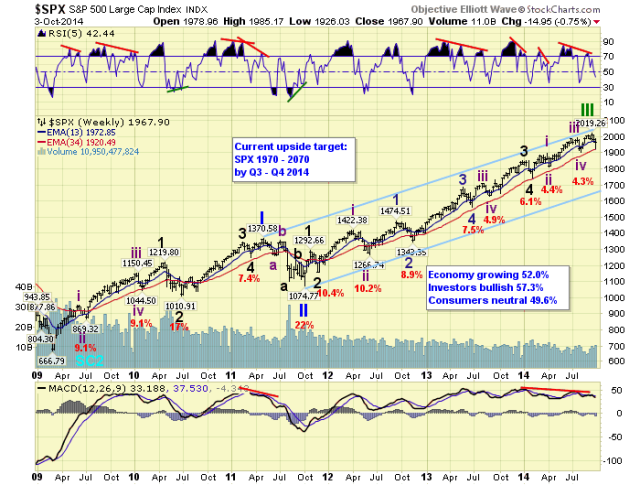
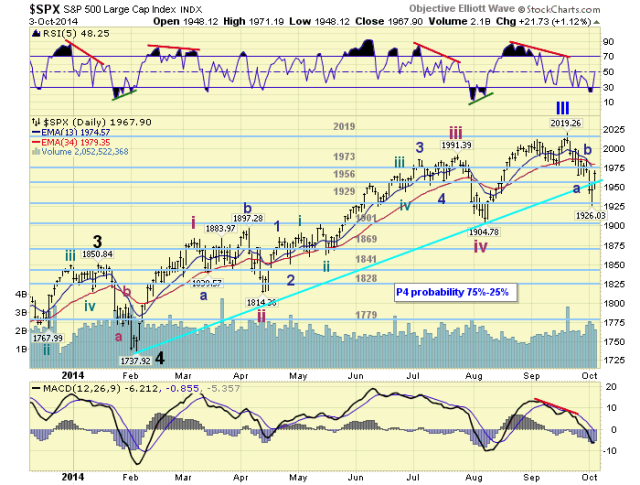
During Primary III the simple Major waves 1 and 2 completed in late-2011. Major waves 3 and 4 completed in early-2014. Major wave 5 subdivided into five Intermediate waves, and appears to have completed in September. Due to several technical parameters, which we elaborated on last weekend and during the week, we rate the probably on Primary IV underway at 75%/25%. To remain objective there is still one possible count for Primary III to extend. This would be a subdividing Intermediate wave v. Since SPX 1905 was not exceeded during this weeks decline, which would have eliminated this possibility, we do not rate Primary IV as a 100% probability.
MEDIUM TERM: downtrend
This week the market confirmed a downtrend from the recent all time high of SPX 2019. The market declined to SPX 1926 and then an interesting thing happened. At that low, which was 4.6% from the high and within days of the downtrend confirmation, the market rallied. This was interesting in that the last two corrections declined 4.3% and 4.4%, and bottomed within days of a downtrend confirmation as well. Also at the low the Dow hit its lower rising trend line, and the R2K hit the 1080-ish support that has held all this year. If one favored an extending Primary III scenario, this was a perfect setup to go long. And, the market had its best rally since the downtrend began. We have a series of charts, however, that suggest another extension of Primary III is probably not underway.
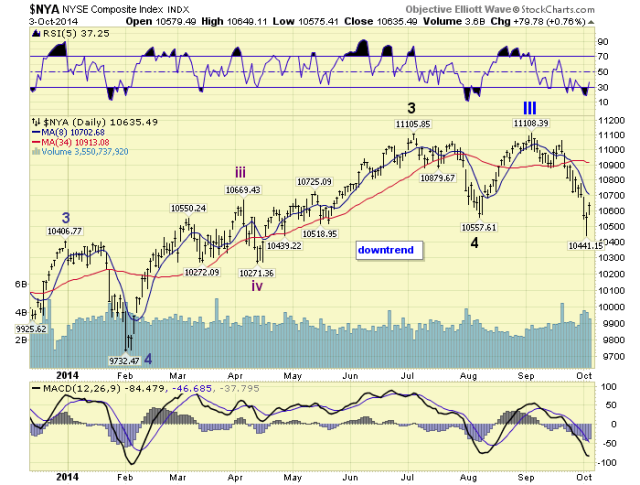
The NYSE appears to have ended its Primary III in September, and has already dropped below its recent downtrend low. This would be 1905 in the SPX.
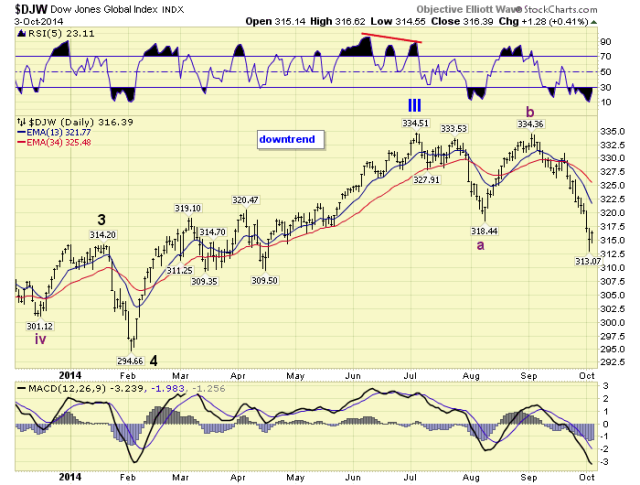
The DJ World index ended its Primary III in July and has done an a-b-c since that high, and also dropped below its recent downtrend low.
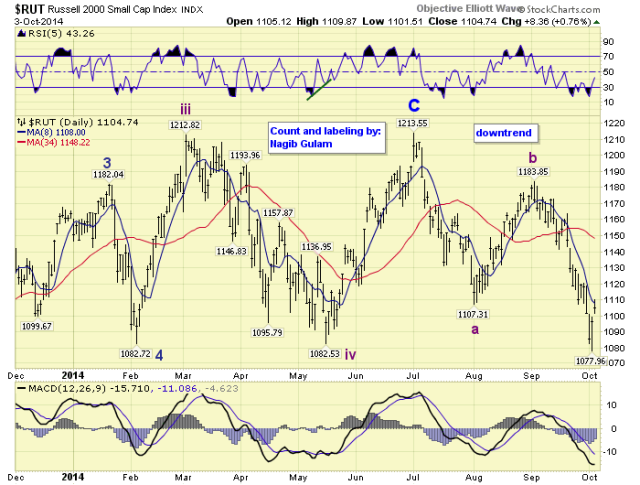
The R2K, mentioned earlier, has a similar pattern to the DJW. It also peaked in July and has made an a-b-c decline since then with again the lower low.
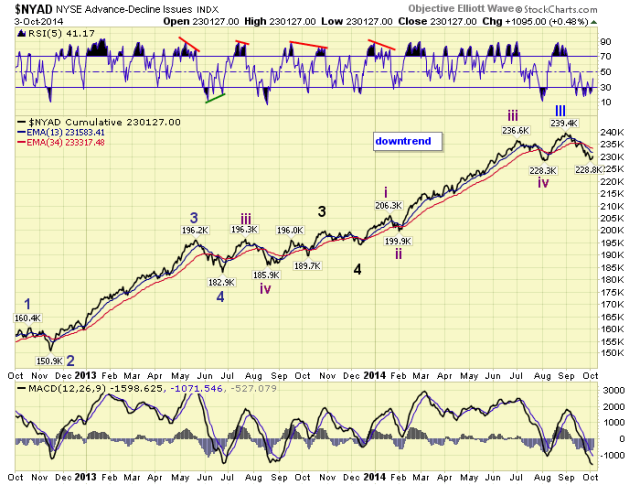
The NYAD ended its Primary III in late August and has been declining ever since. Notice the recent two day rally look like just another uptick in a declining trend.
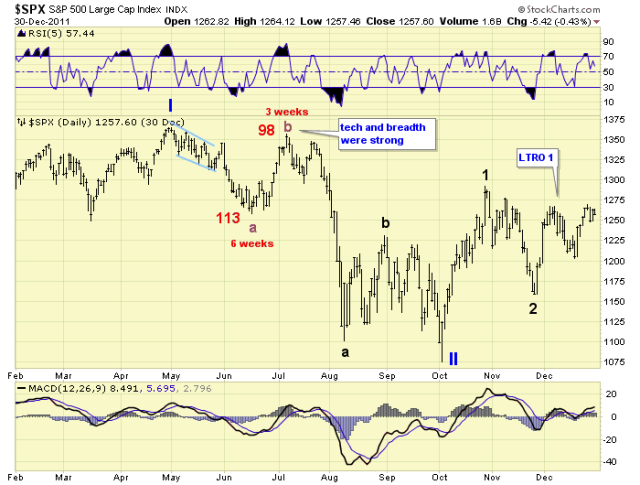
This last chart is Primary wave II. Notice the early stages of the decline in May were corrective, and then the market had a strong rally closing at the high for the day. The following day, however, that entire rally was nearly wiped out as the downtrend resumed.
There are many more charts that do not look good, especially in Europe. Medium term support is at the 1929 and 1956 pivots, with resistance at the 1973 and 2019 pivots.
SHORT TERM
We counted the initial 55 point decline as Minor A: 1979-2000-1964. Then a 21 point rally for Minor B to 1985. After that we had a 59 point decline, in seven waves, to SPX 1926. We initially thought, since the rallies were quite small that this decline was only Minute a of Minor C. By Friday morning, however, we realized it was all of Minor C and labeled the low Intermediate A. Overall Minors C and A were about an equal 55 points, and Minor B was also a Fibonacci 21 points.
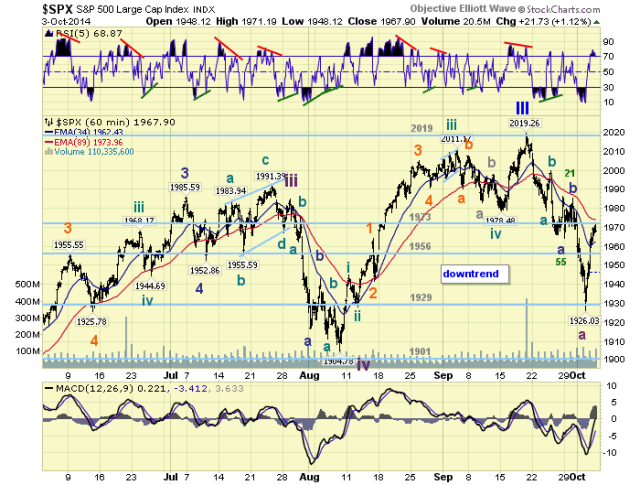
The entire decline of Int. A was 93 points, which is also close to the Fibonacci 89. This suggests Int. wave B may also be close a Fibonacci number, i.e. 55. Using Fibonacci retracements levels we arrive at two potential resistance levels: 1973 (50% retrace) and 1983 (61.8% retrace). These relate to the 1973 pivot, and the Minor B wave highs 1985/1986. We would expect the current rally, Int. wave B, to end near these levels. Should the market continue higher, passing these levels, we would give some consideration to another Primary III extension, with a subdividing Int. wave v. Short term support is at the 1956 and 1929 pivots, with resistance at the 1973 pivot and SPX 1985/1986. Short term momentum ended the week overbought.