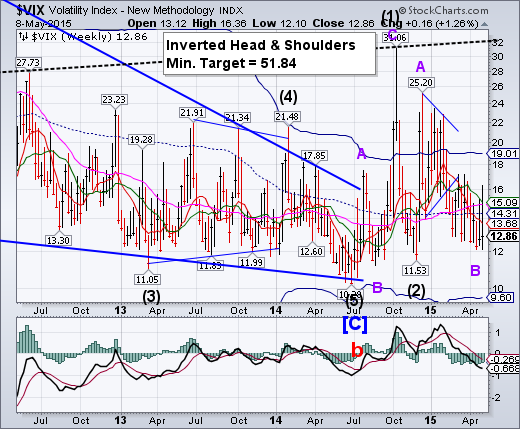
-- VIX made a new Cycle low on Monday, then proceeded to run through all the resistance levels before closing at an 86% retracement and a credible reversal pattern. A close above last week’s high may confirm a sell signal for SPX.
SPX fails at a second attempt at a new high.
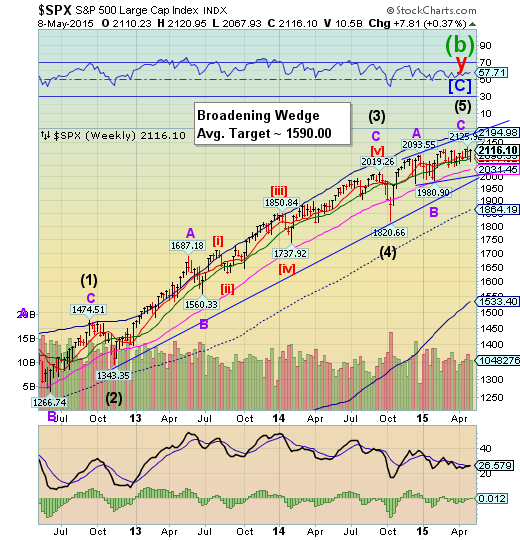
SPX made two lower highs, the second lower than the first, while making a new low this week. Wednesday’s low qualifies as a Master Cycle low. A failure to make a new high here would make the Cycle extremely left-translated and bearish. The next decline may not be saved at the long-term trendline as the last one did on October 15.
(WSJ) U.S. stocks rose sharply after the April employment report showed an economy continuing to grow, but at a pace that investors believe could keep the Federal Reserve from raising interest rates until late this year.
The Dow Jones Industrial Average jumped 267.05 points, or 1.5%, on Friday to 18191.11. The S&P 500 rose 28.10 points, or 1.3%, to 2116.10. The Nasdaq Composite climbed 58.00 points, or 1.2%, to 5003.55.
(ZeroHedge) While the April payrolls came almost precisely as expected, at 223K, a tiny 5K below the 228K expected, the reason stock are soaring is that the already abysmal March payroll prints was revised even lower to just 85,000, the weakest print since June 2012, and pushing the 3 month average job gain to under 200K, or a level which the Fed has indicated previously it will hardly do much if anything material.
NDX makes a reversal pattern.
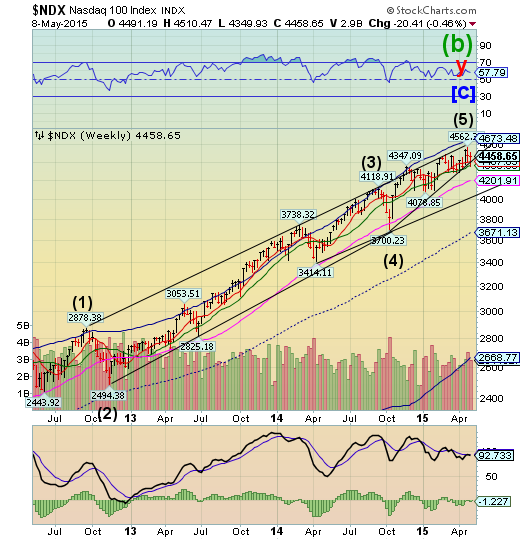
NDX made its final hifh on April 27. Since then it has impulse down and made a 54.5% retracement. Its trendline is at 4400.00. Breaking the trendline implies a complete retracement to its October 15 low at 3700.23.
(FirstRebuttal) Seems as though we have perpetual state of hedge fund conference with all those biggest and brightest men (wish I could say and women) in the world of finance. The conferences are set to provide a forum of discourse and a sharing of ideas. Surely has nothing to do with egos. Actually I’m sure it does but that’s no different from Hollywood and all of the self celebratory events they now have. This is our world, love it or leave it.
Listening to these guys today and over the past few conferences we definitely hear less euphoria but we still hear very little honesty from this crowd. Almost no one is willing to admit that the US markets have gone complete crazy and are not just overbought but grossly overvalued to levels never before seen. I can’t tell you how many guys suggest and/or agree that the markets are about average relative to historic valuations.
High Yield Bonds may have truncated its final attempt to make a new high.
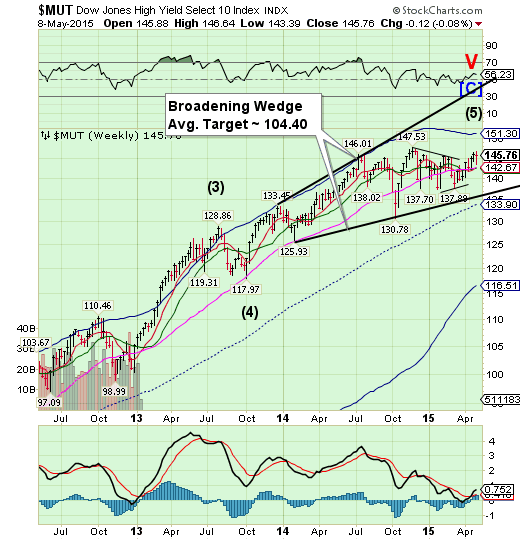
Try as it might, the High Yield Index has not been able to better its November 28 high at 147.53. The best fit Elliott Wave formation is an A-B-C, with Wave C falling short of the top of Wave A. That consolidation in the middle turns out to be a Triangle, which calls for a final probe to a new high, but no luck so far. There is a probability that MUT may not make a new high above the November 28 high. That would be labelled a “truncation.” A failure at this point may cause difficulties in new high yield financing that has supported stock prices during a declining macroeconomic environment. This may not end well.
((BusinessInsider) The entire existence of the high-yield bond market is during secularly declining rates," DoubleLine's Jeff Gundlach said. This was a key theme in Gundlach's presentation titled "Summer Insects," which he gave late Tuesday to a room of investors at the New York Yacht Club. Gundlach argued this market was exposed to a unique set of risks that will intensify in the coming years.
High-yield bonds, or "junk" bonds, are bonds issued by companies of relatively low credit quality. Because of the higher risks that come with lending to such companies, they have to offer higher yields than those of their investment-grade peers.
The euro rally may be over.
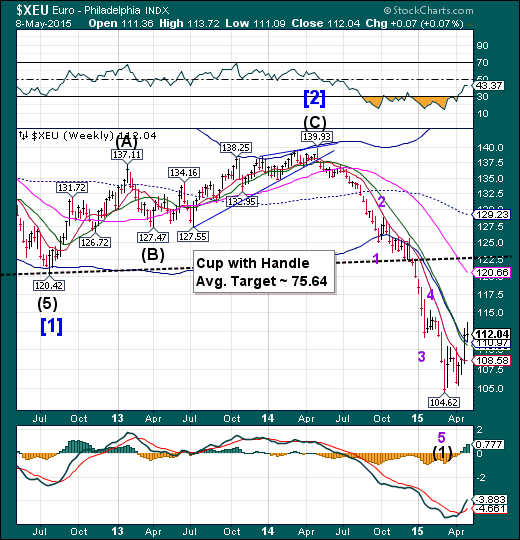
The euro rally has run out of time. The euro rally has topped as the Cycles Model has forecast. It has fallen short of its target of 115.34. The Model now forecasts six weeks of weakness, and possibly a panic decline in the euro. The talking heads still appear to be on the wrong side of this trade.
(CNBC) The euro, which was one of the biggest consensus shorts in the first quarter, has skyrocketed—soaring nearly 9 percent from its low hit just three weeks ago. And one technician, who recently called for a steep correction in the currency, said the charts are now setting up for an even bigger rally.
"The chart of the euro shows significant upside," technical analyst Rich Ross said Thursday on CNBC's "Trading Nation."
DJ Euro Stoxx closes beneath its cycle Top resistance.
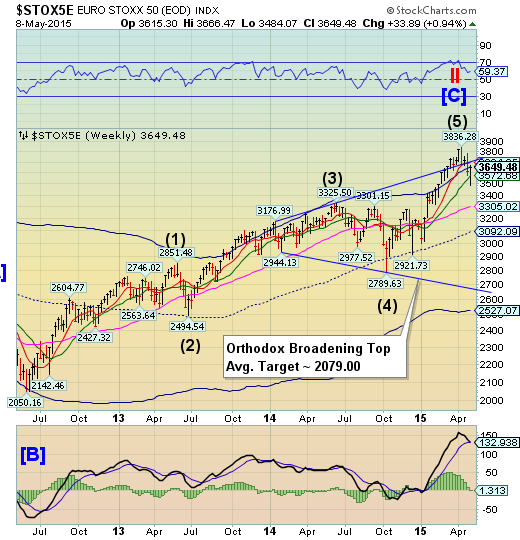
After running down through Short-term and Intermediate-term support, the Euro Stoxx 50 bounced back and closed under its weekly Cycle Top resistance at 3657.10. Weekly action is now within the Orthodox Broadening Top formation. This may be considered a reversal in trend that may receive further confirmation by declining beneath its Long-term support at 3537.00. The Cycles Model suggests a potential panic decline into the third week of May to kick off the new trend.
(MarketWatch) European stocks leapt Friday, powered by British shares, as the Conservative Party unexpectedly swept into power after the U.K. general election.
The Stoxx Europe 600 SXXP, +2.87% rose 2.9% to 400.16 closing near its intraday high of 400.18 after U.S. stocks DJIA, +1.49% SPX, +1.35% surged in the wake of a solid U.S. April jobs data Friday. For the week, the pan-European benchmark rose 1.4%
The yen continues its sideways consolidation.
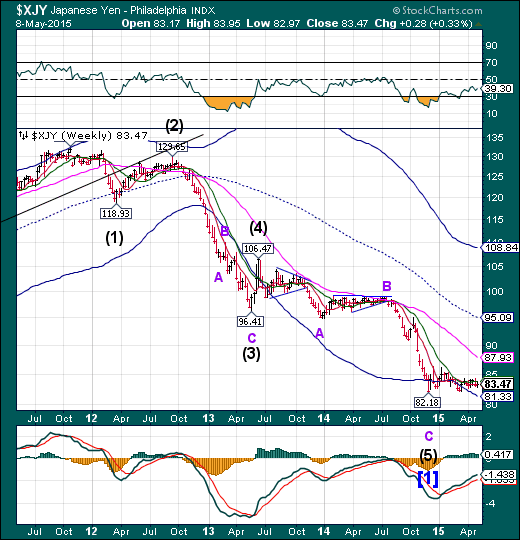
The yen continues its sideways consolidation, unable to break either up or down. All indications point to a probable strong breakout. The Cycles Model suggests a period of strength is approaching. This is the opposite of what many analysts are saying.
(Bloomberg) Speculators unwinding bets against the yen risk adding to the litany of wrong calls that has bedeviled foreign-exchange traders this year.
The dollar traded near a three-week high versus the yen even as bullish bets for greenback were cut to levels last seen before Japanese Prime Minister Shinzo Abe took office in 2012 promising reflationary policies. The U.S. currency is little changed against the Japanese counterpart this year even as the Federal Reserve discusses raising interest rates and the Bank of Japan continues to carry out unprecedented easing.
“With risks that U.S. markets are forced to re-price for a first Fed move no later than September and possibly June or July, then dollar-yen below 120 yen looks like a steal,”
said Ray Attrill, global co-head of currency strategy at National Australia Bank Ltd. in Sydney.
The Nikkei is still beneath its April 23 high.
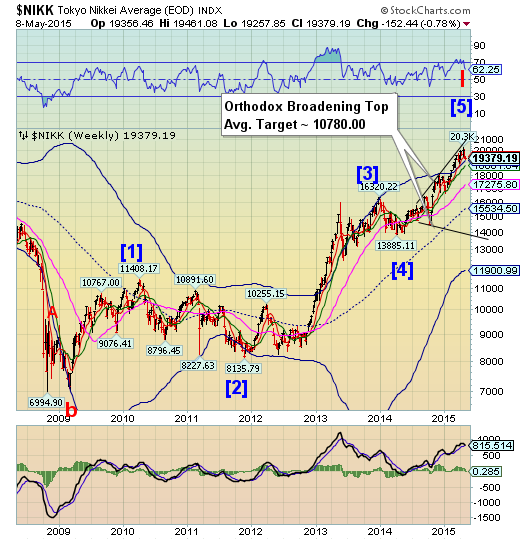
The Nikkei continues to weaken beneath its April 23 high at 20252.12. A period of weakness is taking hold, which may last through May 20. The reversal may be confirmed with the loss of weekly Short-term and Intermediate-term supports.
(TheStreet) -- Japanese equities, measured by the Nikkei 225 index, are off to another impressive year so far, outperforming the S&P 500 by almost 10 points. The Nikkei 225 even reached a historical milestone this year, reaching levels not seen since 2000. While bulls celebrate these fresh 15-year highs, storm clouds are gathering overhead, as the market creeps closer to a significant correction.
U.S. dollar faces continued weakness
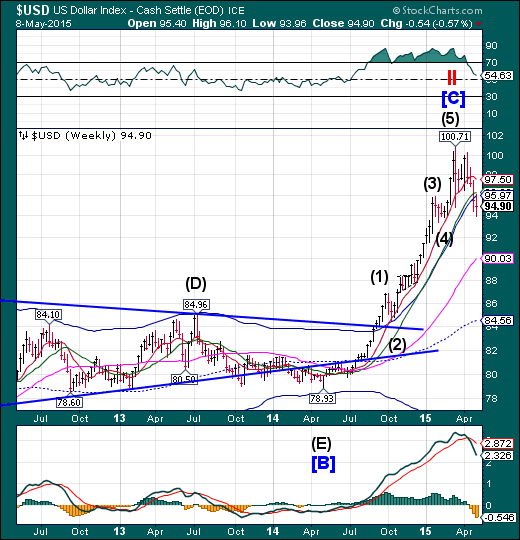
The US dollar faces continued weakness through mid-May. The decline may possibly take USD to Long-term support at 90.03. Critical support has been broken. Dollar longs may be crushed in this decline.
(Reuters) - The sharp rise in the U.S. dollar's value is hitting American exporters and forcing layoffs at makers of everything from steel to machinery, taking the shine off stronger job creation across the broader economy.
Exports make up about an eighth of America's economic output and helped power the initial economic recovery from the 2007-09 recession.
But exporters' job losses do raise some concerns about economic growth as the Federal Reserve moves closer to its first interest rate rise since 2006.
USB bounces, but the decline isn’t complete.
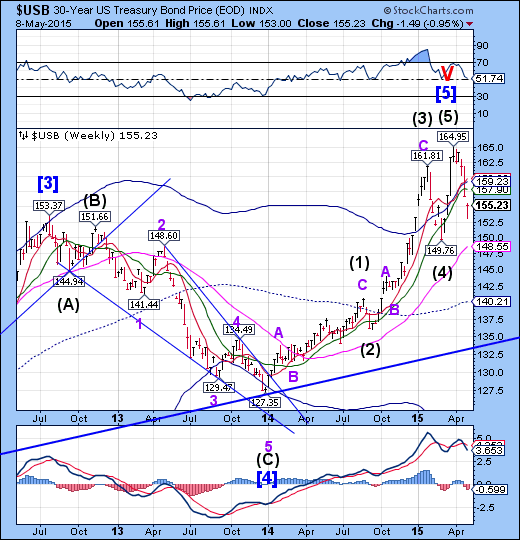
The Long Bond bounced from a significant low at 153.00 on May 6, but may soon resume its decline to deeper lows by the end of May. Last week’s call for a bounce was correct. However, the rise in bonds may be short-lived, as there is a period of weakness that may overtake USB through the end of the month. The target for this decline may be the weekly Long-term support at 148.55. Bonds may be short-term oversold, but may become more so.
(ZeroHedge) Based on the most mainstream of mainstream overbought/oversold indicators (a 14-day RSI), the 30-Y Treasury bond has not been this oversold since June 2007 - 9 years ago and a very memorable peak in yields.
As Kessler notes, in that period, the 30yr peaked on June 12th, 2007 at 5.36% (30yr yields have been lower every day since then). Over the next month, the yield had fallen 16 basis points. Over the next 3 months, the yield had fallen 61 basis points, 6 months, 74 basis points. Finally, this big movement culminated in about a year and a half, as the yield had fallen 280 basis points to the financial crisis low of 2.55% on 12/18/2008.
Gold may trigger its Head and Shoulders formation.
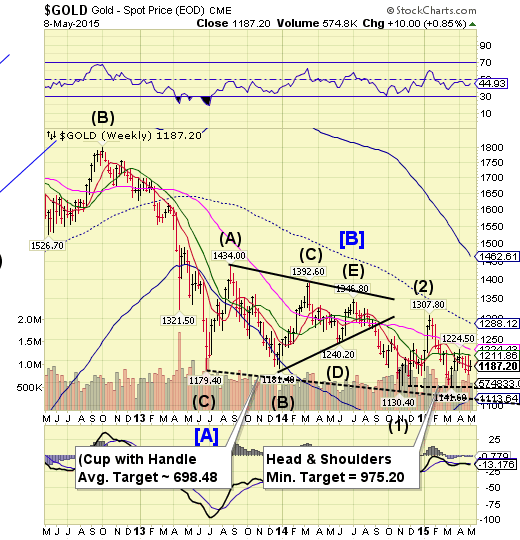
Gold rose from a six week low to challenge Short-term resistance at 1188.57, but closed beneath it. A failure beneath 1141.60 triggers the Head and Shoulders formation with a minimum target of 975.20. The Cycles Model calls for a probable low by May 20.
(WSJ) Gold prices rose after some investors wagered that the tepid pace of U.S. hiring would discourage the Federal Reserve from raising interest rates until later this year.
Gold for June delivery, the most actively traded contract, increased $6.70, or 0.6%, on Friday to settle at $1,188.90 a troy ounce on the Comex division of the New York Mercantile Exchange.
Gold futures gained 1.2% for the week.
Crude may be reversing from its retracement high.
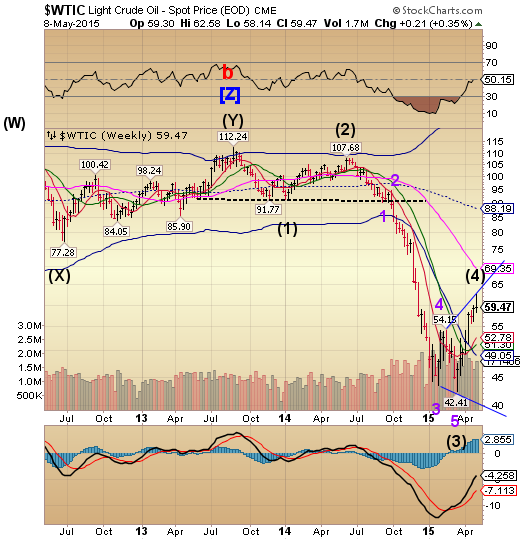
Crude reversed on May 6, in line with the cycles Model after exceeding its target high. The Broadening Triangle Formation suggests a consolidation or bounce near 40.00. There is a good probability of this decline to extend through mid-to-late May.
(Reuters) While oil futures prices rebound with vigor as analysts cite strong demand, the physical crude market tells a much more cautionary tale.
Tens of millions of barrels are struggling to find buyers in Europe with traders of West African, Azeri and North Sea crude blaming poor demand.
The deep disconnect between the oil futures and physical markets looks similar to the events of June 2014 when the physical market weakness became a precursor for a futures price crash.
Shanghai Index makes a strong reversal.
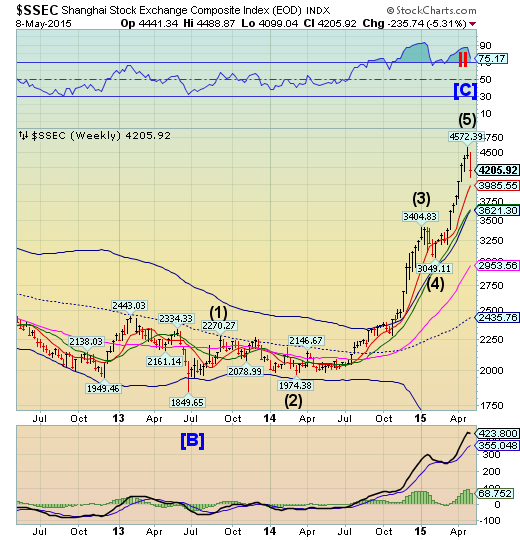
The Shanghai Index appears to have peaked on April 28. Last week’s decline was more convincing, but the Shanghai still has another week of decline before it hits any support for a bounce. Traders may be still trying to “buy the dip.”
(ZeroHedge) Yesterday, when we heard that China brokers may impose tighter margin requirements to contain what is now a laughable stock bubble we said that tonight's Shanghai session could get exciting:
It did: overnight the Shanghai Composite tumbled by 4.1% to under 4300, the biggest one day drop since January 19.
Additionally, the Shanghai Stock Exchange Property Index falling 8% although keep in mind that the sub-index added 52% in 3 months to end-April on relentless hopes of central bank easing the worse the economic data got. The rout also spread to Hong Kong where the HSI dropped as much as 1.9%, down 4th day in longest loss streak since March 11
The Banking Index fails to make a new high.
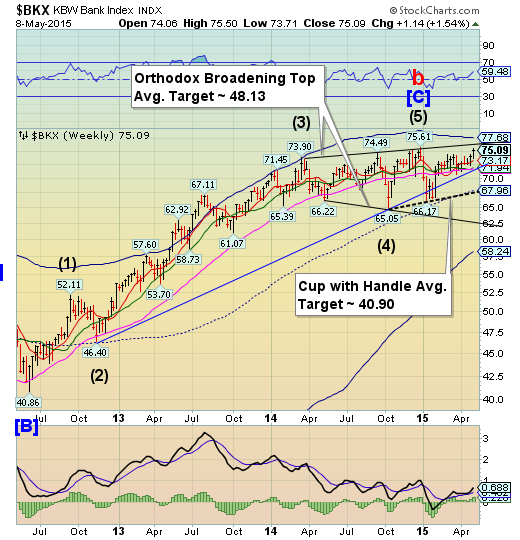
--BKX peaked on May 5, but did not make a new high. This kind of action is bearish but frustrating until supports finally give way. A resumption of the decline may break several critical supports and trigger as many as three bearish formations. The Cycles Model now implies that the next decline may last through mid-May. Could this be a waterfall event?
(OfTwoMinds) The money multiplier effect no longer works.
As you (hopefully) know, we live in a fractional reserve banking system: if the bank is required to have $1 in cash reserves for every $10 in loans, it means the bank creates $10 of new money when it issues a $10 loan. When the $10 loan is paid off, that money vanishes from the system.
The problem with fractional reserve lending is the leverage. A 10-to-1 reserve ratio means that if the bank issues a $10 loan, the borrower defaults and the borrower's collateral (home, auto, etc.) only fetches $8 on the open market, the bank lost $2, which is more than the bank's cash reserves ($1). At that point, the bank is insolvent, i,e, its losses exceed its assets.
In credit bubbles, the reserve requirements may reach absurd levels of leverage. At a reserve ratio of 100-to-1, a $2 loss of value in a $100 loan will push the bank into insolvency, as it only held $1 in cash as reserves against the $100 loan.
(ZeroHedge) When Deutsche Bank's head of global fundamental credit strategy, Jim Reid, writes a blurb that could have come from any single Zero Hedge article posted here over the past 6 years, it makes us wonder if we, like that Onion, have missed our IPO window.
I don't think it’s too controversial to say that personally I believe that capitalism is generally the best economic system. However part of the problem today is that over the last 15-20 years, capitalism has been propped up every time it’s about to go through one of the cyclical creative destruction phases.
Compounded up that's left us with a big mess to clear up across the globe and a lot of sub optimal resource allocation. That's not the fault of capitalism per se it's the fault of the authorities for not letting cycles naturally evolve. This has become increasingly more difficult as the imbalances build on top of each other.
(ZeroHedge) Last week we commented on the latest travesty in the legal system when Deutsche Bank paid $2.5 billion to settle charges that it had manipulated LIBOR, EURIBOR and various other -BORs. As usual in situations such as this one, not a single banker went to prison, but there was some hope that Deutsche Bank's gross criminal conduct would at least land it on the SEC's "bad actors" list, which is like the Dodd-Frank equivalent of ‘time out’ and restricts the offender from participating in exempt securities offerings.
