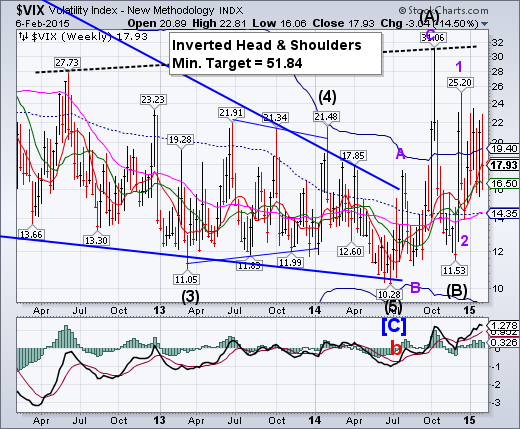
-- VIX closed closed within its 5-week trading range, still poised for a potential breakout above its October 15 high. The Cycles Model projects a probable rally top by mid- February. It may get very exciting.
SPX bounced from Long-term support, but still negative for the year.
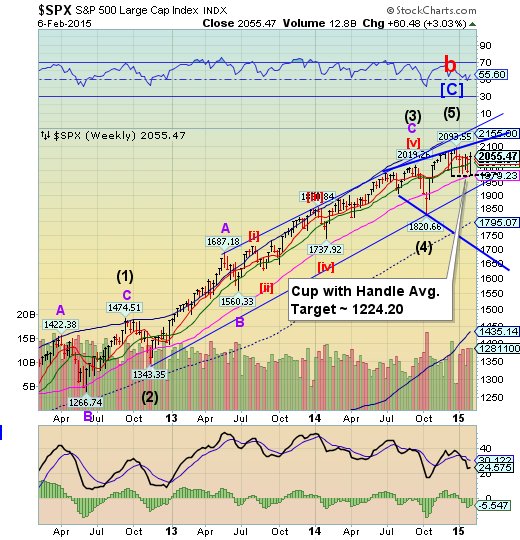
SPX tested Long-term support at 1979.23 before bouncing to the top of its trading range, but missing the year-end close at 2058.90. These tests of support show a gradual breakdown of critical supports. A sideways consolidation becomes more dangerous as time progresses. The direction of the break of this pattern will lead to a very powerful move. The sideways formation has resulted in a Cup with Handle formation that, if broken, may produce a very bearish result.
(ZeroHedge) The Dow Jones Industrial Average closed today at 17,824... exactly 1 point higher than the close at the end of 2014 thanks to a sudden urgent need to sell VIX protection (because with tensions between EU and Greece at its highs, who would want any hedges into the weekend?) and bid the Dow straight up 20 points in the last minute... here's why..
Because when 'mom-and-pop' watch the news tonight and see a higher unemployment rate and that stocks closed red... there needs to be an angle to explain why everything is awesome and the crisis has passed...
NDX bounced, but fails to make bullish criteria.
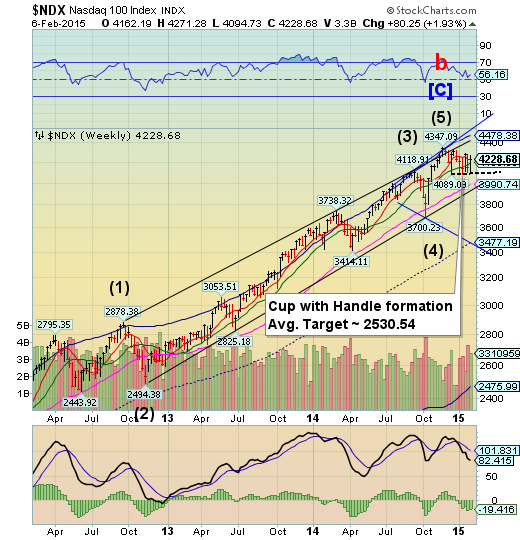
NDX also attempted a bounce above its trading range, but was stopped at weekly Short-term resistance and fell short of the year-end close at 4236.28. It also failed to fill an open gap at 4275.72, a critical miss. It also displays a Cup with Handle formation with a very bearish outcome when the trendline is crossed. The next critical support is the weekly Long-term support at 3990.74 and beneath that is the 3-year trading channel trendline. There are approximately 2 more weeks of possible decline in this cycle and a lot may happen in that time span.
(ZeroHedge) Following the January jobs report, Goldman's chief economist Jan Hatzius appeared on CNBC but instead of joining Steve Liesman in singing the praises of the "strong" the report (which apparently missed the memo about the crude collapse), he decided to do something totally different and instead emphasize the two series that none other than Zero Hedge has been emphasizing for years as the clearest indication of what is really happening with the US labor market: namely the recession-level civilian employment to population ratio and the paltry annual increase in average hourly earnings.
High Yield bounce produces a more bearish possible outcome.
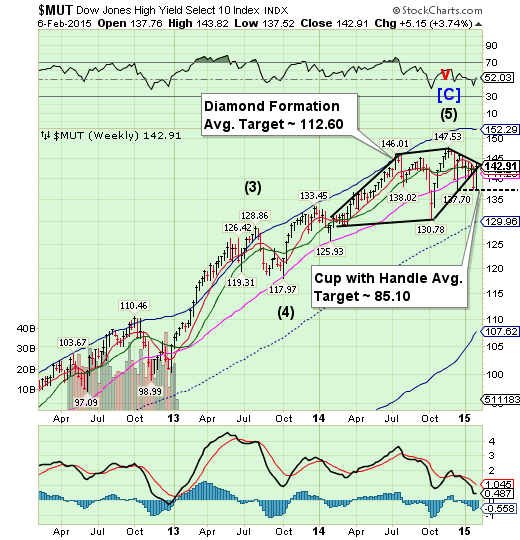
The High Yield Index appears to be retesting its Diamond Formation which forecasts a probable decline to its Cycle Bottom at 107.62. This action has produced a Cup with handle formation with even more bearish results. The decline may last through mid-February, according to the Cycles Model. The mainstream press has no idea what might be coming…
(Forbes) European high-yield bond issuance made a robust start to the year, generating the largest January volume since LCD started tracking the market in 2006. The €7.3 billion of new issuance surpassed €5.7 billion recorded in the first month of 2014, and the previous January record set in 2013, when €6.9 billion came to market.
The asset class showed its strength and stood firm in primary, despite early macro challenges from falling oil prices and softer equities. The ECB’s announcement of long-term support for the market through quantitative easing measures helped firm up sentiment, as QE should ensure benchmark yields remain low for the foreseeable future.
The euro bounced, but may not have made its Cycle low yet.
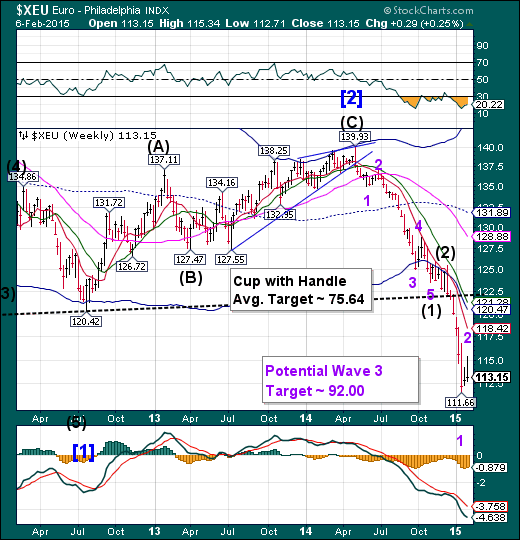
The euro bounce appears to be over. It anticipates its next Master Cycle low (Wave 3) in mid- February, which may produce quite a fall. The discussion now is, How far below parity will the Euro go?
(Telegraph) Greece saw its credit rating cut on Friday night, with Standard & Poor's warning the country's cash constraints could force it to leave the euro.
S&P downgraded Greece to B- from B, one notch above default range, and kept the outlook on the nation at "negative", meaning further cuts to the rating are possible.
The ratings agency said the amount of time Greece’s new government has to reach an agreement with its creditors over its €240bn bailout has shrunk, with its worst-case scenario seeing the country being forced to leave the euro after European funding dries up.
EuroStoxx retests its Cycle Top.
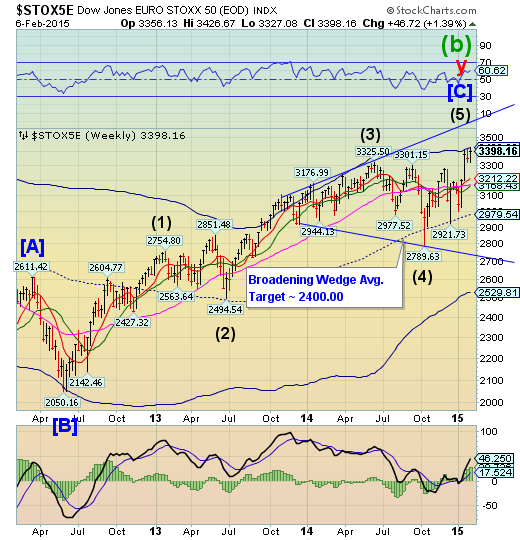
The EuroStoxx 50 Index retested its Cycle Top resistance at 3429.28, but could not overcome it. We have been warning that EuroStoxx may not go above its Cycle Top in its final attempt at the peak. The Model now suggests the next low may come mid-February.
(ZeroHedge) he Greek situation summaries Greece by Deutsche Bank's George Saravelos have consistently been among the best in the entire sellside. His latest Greek update, which is a must read for anyone who hasn't been following the fluid developments out of southeast Europe, which fluctuate not on an hourly but on a minute basis, does not disappoint.
But while his summary of events is great, what is of far greater significance is his conclusion, namely that ultimately Europe will fold: "we consider the most likely outcome to be a eurogroup offer of a new Third program" and "given that the current program expires this February the offer to negotiate a new Third program may provide political room for the government to sit on the negotiating table. At the same time such an offer is very likely to be attached to strict conditions, with the willingness to accommodate t-bill issuance an open question. Developments overnight suggest that this has become less likely, imposing maximum pressure on the government to reach agreement within a matter of weeks."
The yen is building a base.
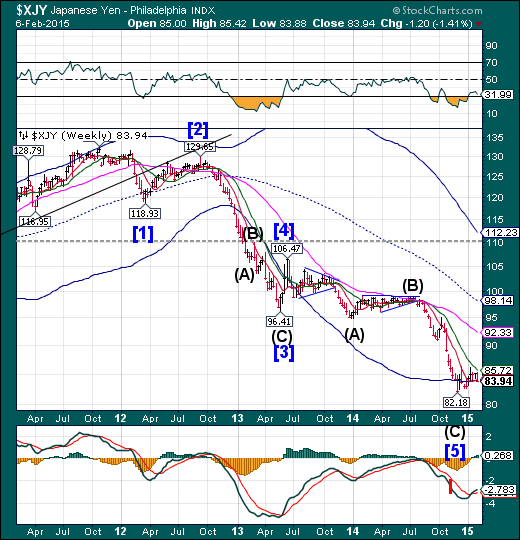
The yen appears to be building a base above support provided by its Cycle Bottom at 83.94 and weekly Short-term support at 84.16. It has yet to overcome its December 16 high at 86.34. Once the breakout occurs, the Yen may gain momentum in its rally, since most traders have not recognized a change of trend…yet.
(Bloomberg) -- Add the Bank of Japan to the list of central banks taking currency traders by surprise.
The yen’s 2 percent gain versus the dollar this year, second only to the Swiss franc among the Group-of-10 currencies, is a rally strategists didn’t forecast and investors were betting against. After the yen’s steepest three-year drop on record, markets were used to the idea that the currency was only going down as Japan’s policy makers unveiled ever-greater stimulus to reverse deflation.
Yet since the BOJ expanded its bond-purchase plan to an annual 80 trillion yen ($682 billion) on Oct. 31, speculation for more easing has amounted to nothing as the world’s third-largest economy shows signs of improvement. At the same time, central banks from Canada to the euro region have shocked with new easing measures, sending their currencies tumbling.
The Nikkei was positive, but no new highs .
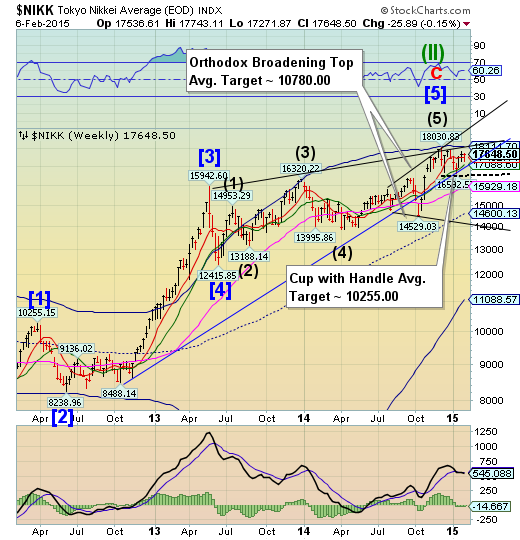
The Nikkei failed to make a new high this week and now appears ready to make a potential 2 week decline into a Trading Cycle low. The attempted rally has produced a new chart pattern that suggests a possible waterfall event in the making. The Orthodox Broadening Top agrees with that outcome, since it represents a market that is out of control and has a highly emotional public participation. This may be the start of a dramatic decline that is imminently due.
(Bloomberg) -- In Japan’s stock market, companies have never been more profitable and investors never more skeptical.
Annual earnings on the Nikkei 225 Stock Average are poised to reach a record 21.6 trillion yen ($184 billion), according to estimates compiled by Bloomberg. At the same time, short sales peaked at 37.8 percent of all transactions on the Tokyo Stock Exchange on Jan. 6, eclipsing past highs after the index recorded its biggest quarterly advance in a year.
U.S. dollar may have completed its retracement.
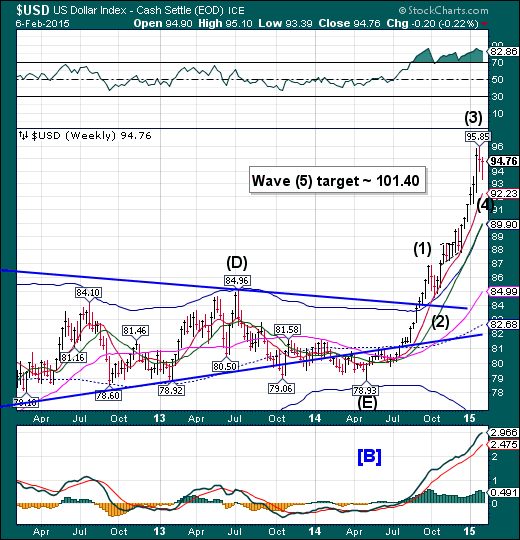
The US dollar appears to have completed its retracement prior to its prior to its final push toward its near-term target of 101.40. The Cycles Model suggests that the dollar may now resume its rally through May. The expected retracement now appears to be over.
(Bloomberg) When officials from the Group of 20 nations gather in Turkey next week, the worsening currency wars will likely be a source of friction. The biggest question is whether the United States will finally get sick of being a casualty in the ongoing skirmishes.
With nations from Canada to Australia to China to Denmark springing surprise rate cuts on investors in recent weeks, everyone has been in a race to the bottom, devaluing their currencies to boost exports and growth. Everyone, that is, except the U.S.
In the past year, the dollar has surged against the currencies of the U.S.'s trading partners. It's up more than 16 percent against the Federal Reserve's trade-weighted index of 26 other currencies, ranging from the euro (which accounts for 16 percent of the basket) to Switzerland (1.73 percent) to Colombia (0.66 percent):
USB may have completed its retracement.
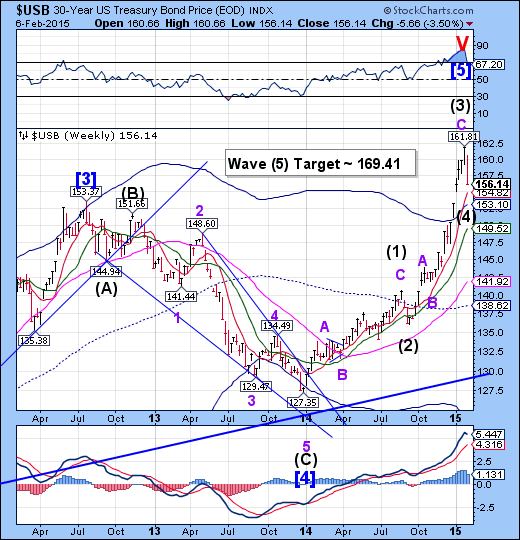
The Long Bond may have completed its Wave (4) retracement. Last week was projected to be a high, but the Cycle inverted. This Cycle inversion may mean that USB appears to be in a position to attract capital that may be fleeing stocks and commodities.
(WSJ) A robust U.S. employment report sent government bond prices tumbling for a fourth straight day and fueled an uptick in bets the Federal Reserve will raise short-term interest rates at its June meeting.
The yield on the 10-year note posted the biggest one-day increase since November 2013, and the yield on the two-year note jumped the most on a one-day basis since 2009. Yields rise as prices fall.
The yield on the 10-year U.S. Treasury note rose to 1.94% late Friday from 1.815% Thursday, marking the highest closing level since January 9. The two-year note’s yield increased to 0.643%.
Gold declines, losing critical supports.
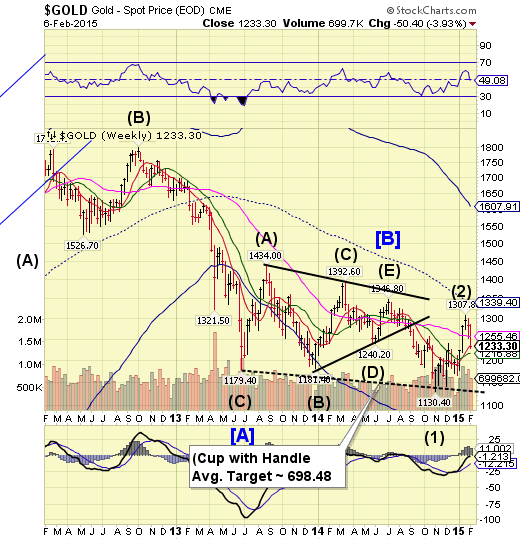
Gold declined another 50 points this week, closing beneath both weekly Long-term support at 1255.46 and Short-term support at 1235.26. This implies that the decline may challenge the Lip of the Cup with Handle formation by mid-February.
(Reuters) - Gold fell more than 2 percent on Friday as global stock markets and the dollar rose on stronger-than-expected U.S. jobs data, raising expectations that the Federal Reserve will increase interest rates by midyear.
U.S. nonfarm payrolls increased by 257,000 last month, topping expectations for 234,000, with the unemployment rate ticking up to 5.7 percent due to more people entering the labor force.
"The U.S. employment report was good and there has been quite a sharp adjustment in interest rates expectations, with 10-year Treasury yields up 10 basis points," ABN Amro analyst Georgette Boele said.
Crude tested resistance, may resume its decline.
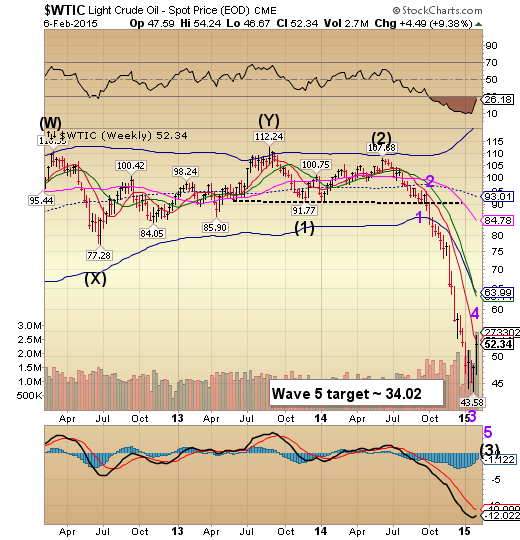
Last week I suggested, “Crude began what may be a week-long rally before the next phase of its decline. Crude may need a retest of its Short-term resistance, currently at 54.51 before restarting its decline. This rally may shake out the weaker short positions before the decline resumes.” The weaker hands are now shaken out. The Cycles Model now suggests it’s time to resume the decline.
(WSJ) Oil prices posted their largest weekly percentage gain in almost four years as traders looked past the current world-wide glut of crude to focus on signals of future production cuts.
Some market participants said oil prices, which have fallen 52% in the past seven months, could be bottoming out as producers have reacted to the low prices by cutting expenditures and reducing drilling activity. But many analysts caution that the global oil market still is oversupplied and there are few signs of a major uptick in demand, so prices could slip yet again.
Shanghai Index loses Short-term support.
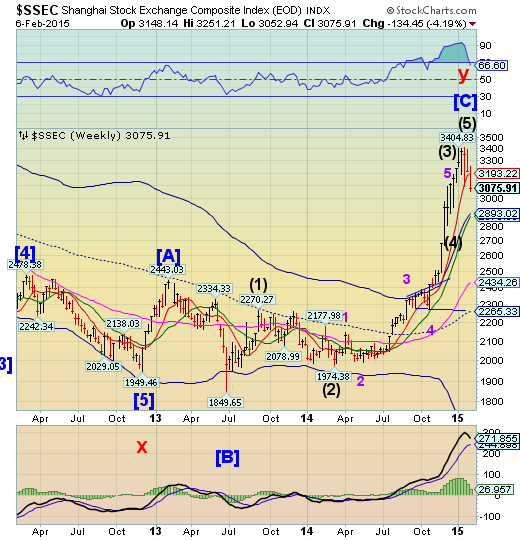
The Shanghai Index fell beneath Short-term support at 3193.22 this week, and appears to have begun its descent. The Shanghai Index appears to be on a sell signal for the next two weeks. The decline may go to weekly Long-term support at 2434.25 or possibly mid-Cycle support at 2265.33 by mid-February. Volatility is on the rise in China, despite massive liquidity injections.
(ZeroHedge) To say that the PBOC is confused at this moment is a very big understatement: on one hand, yesterday the PBOC moved its reference rate for the yuan outside the daily trading band for the first time in 21 months, forcing the currency to strengthen as authorities seek to limit volatility in capital flows. And then just hours later, as reported first thing this morning, the same PBOC announced its broad RRR cut - the first one since May 2012 - an attempt to ease ongoing, and thus tightening, capital outflows, and pushing the currency lower in the process. In short: unlike other central banks who hope that institutional and retail investors figure out their FX intentions and help them out by "frontrunning" their moves (which may never come) in what is now a clear and global currency war, China is certainly not making it easy for FX traders to figure out what will happen next.
The Banking Index attempts a rebound, fails at Intermediate-term resistance.
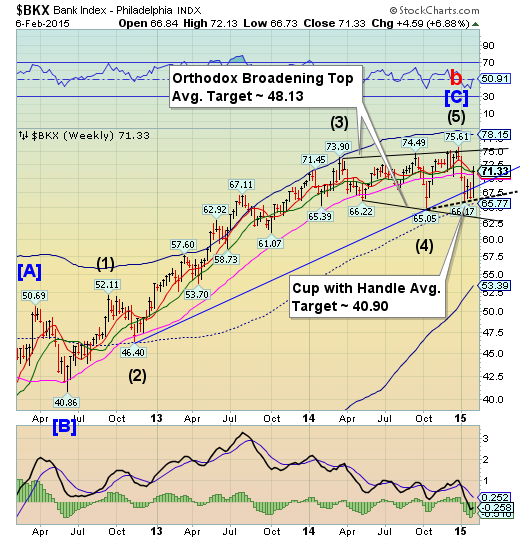
-- BKX challenged its Intermediate-term support at 71.35, but failed to close above it. A decline through the Lip of the Cup with Handle formation puts into place one of the most bearish formations known. In addition, a decline beneath the lower trendline of its Orthodox Broadening Top at 62.60 also triggers that formation as well. The Cycles Model now implies that a significant low may be due by mid-February that may fulfil those requirements. Could this be a waterfall event?
(WSJ) Greek banks have a cushion, but it isn’t looking too comfortable.
The European Central Bank will no longer accept Greece’s government bonds to secure funding for its banks. This funding is tight and will only become more so if Greek depositors start to doubt the Syriza-led government’s death-or-glory negotiating tactics with Europe. Pulling their cash in greater volumes would quickly put the Greek financial system under serious strain.
Balance sheet data from the Bank of Greece suggests that the system can withstand as little as €70 billion ($80.3 billion) worth of deposit withdrawals, about a third of total Greek deposits, before running out of collateral.
(Reuters) - State intervention could help Italian banks offload soured loans, the governor of the Bank of Italy said on Saturday as the government considers options to mop up problematic debts and revive bank lending to the economy. Bad loans stood at 181 billion euros ($208 billion) in November, accounting for 10.6 percent of all loans at leading Italian banks, which fared worst in a Europe-wide health check of the sector last year.
(WSJ) For banks, the great compression may get worse before it gets better. After years of unremitting complaints that persistently low interest rates are squeezing profits out of the banking system, hopes are high that a change in U.S. monetary policy later this year could finally provide some relief. Now a change under way in the money-market fund industry has cast a shadow of doubt over this.
Fidelity Investments announced plans last week to convert Fidelity Cash Reserves, the largest U.S. prime money-market fund, to a government-only fund. Two other funds are also changing their status. This means that they will shed their private-sector assets in favor of Treasurys and debt issued or backed by Fannie Mae, Freddie Mac and Ginnie Mae.
(ZeroHedge) Just hours after apparently settling its suit with the USA (not at all retaliation for downgrading them), S&P has taken the big red marker out on a slew of European banks:
Downgrades: Credit Suisse Group N (NYSE:CS), Barclays, Lloyds Banking Group Plc (NYSE:LYG), Royal Bank of Scotland Group PLC (NYSE:RBS), Royal Bank of Scotland Group PLC (NYSE:RBS), HSBC Holdings Plc (NYSE:HSBC), and Ulster Bank
Disclaimer: Nothing in this email should be construed as a personal recommendation to buy, hold or sell short any security. The Practical Investor, LLC (TPI) may provide a status report of certain indexes or their proxies using a proprietary model. At no time shall a reader be justified in inferring that personal investment advice is intended. Investing carries certain risks of losses and leveraged products and futures may be especially volatile. Information provided by TPI is expressed in good faith, but is not guaranteed. A perfect market service does not exist. Long-term success in the market demands recognition that error and uncertainty are a part of any effort to assess the probable outcome of any given investment. Please consult your financial advisor to explain all risks before making any investment decision. It is not possible to invest in any index.
