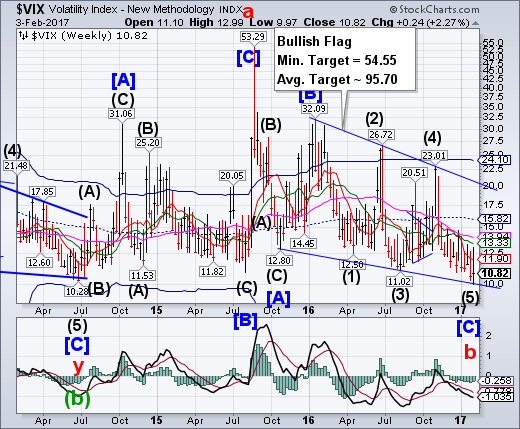
VIX revisited the lower trendline of its massive Ending Diagonal formation on Wednesday, making a key reversal after the FOMC announcement on Wednesday. An aggressive buy signal may be forthcoming should the VIX rally above its Short-term resistance at 11.90.The breakout above the higher resistance zone at 13.33-13.94 implies higher targets to come. The abrupt turn made in August 2015 may be repeated here.
Something strange happened to Wall Street's so-called fear index on Wednesday.The CBOE Volatility Index (VIX), widely considered the best gauge of fear in the market, broke below 10 for less than a minute Wednesday at 2 p.m. ET, right after the Federal Reserve decided to keep interest rates unchanged. While some experts questioned the significance of the move given its brevity, it did mark the first time since Feb. 16, 2007, that the index fell below 10. Experts who spoke to CNBC said the move could have come as a result of an algorithmic glitch or some other anomaly, but it's very difficult to pinpoint the exact cause.
SPX revisits the Broadening Top.
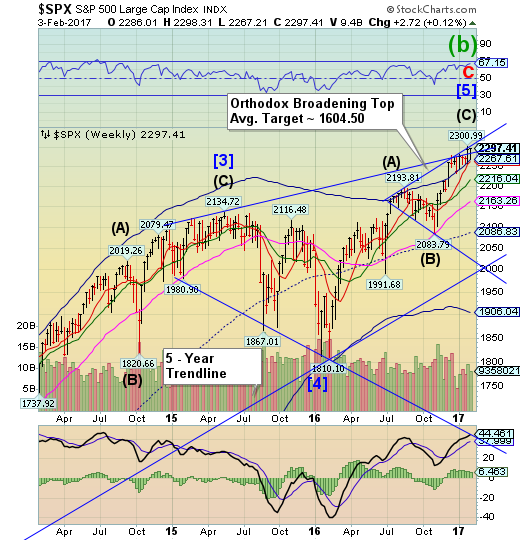
SPX revisited the upper trendline of its Orthodox Broadening Top, which began in July, but did not make a new high. A decline beneath the Cycle Top support at 2267.81 and Short-term support at 2262.72 gives the SPX a sell signal. A break of those supports may send the SPX to its cycle Bottom at 1906.04, or possibly lower.
As we conclude week two of the new Presidential cycle, it certainly has not been dull.
The markets have started struggling with an Administration which is hanging up on heads of state, threatening to send troops to Mexico, discussing border taxes and thinking about doubling the required wages for HB-1 visas. Of course, those issues are still currently offset by hopes for a sea of infrastructure spending, tax cuts and reform and an increase in jobs and wages.
The “hope” is most clearly seen in the sentiment surveys, but remains elusive in the “hard data.” As noted recently by Charlie McElligott via RBC:
The U.S. data has been running at such a clip, as a matter of fact, it’s an increasingly (and massively rhetorical) popular question asked by clients: when do analyst / strategist expectations begin to overshoot?
The NDX retests the Orthodox Broadening Top.
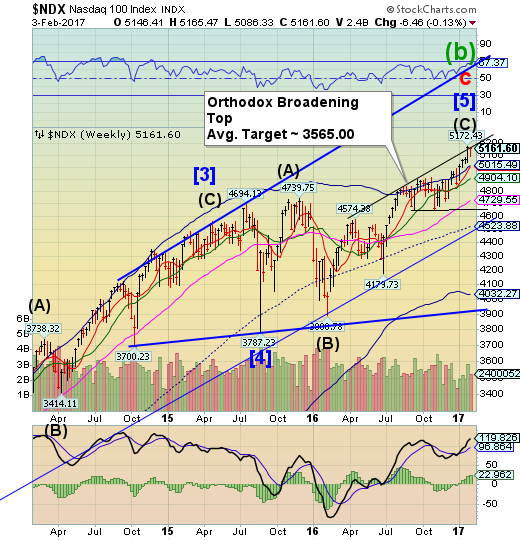
NDX retested the upper trendline of its Orthodox Broadening Top, but could not make a new high. It must cross beneath its Cycle Top support at 5015.49 to give it a possible sell signal. A further break of the weekly Short-term support at 5008.41 confirms a sell signal.
Tired of your barista giving you attitude, spitting in your coffee if you only mention Trump, or misspelling your name on your morning cup of joe? Surely a robot could do better. Well, we are about to find out, because on Monday, Cafe X opened its very first robotic cafe in San Francisco’s Metreon shopping center Digital Trends reports. Promising “precision crafted specialty coffee in seconds, the way the roaster intended,” Cafe X thinks that anything a human can do, its machines can do better. Or rather just one machine.
Nicknamed Gordon, after a Cafe X employee, this robot mans, or robots, two standard professional coffee machines in order to serve up espressos and lattes. In the San Francisco location, customers can grab a cup of coffee with beans from AKA Coffee, Verve Coffee Roasters, or Peet’s. While the coffee itself may not make Cafe X stand out from the competition, the startup hopes that the robot’s efficiency and utility will.
High Yield Bond Index bounces off Intermediate-term support.
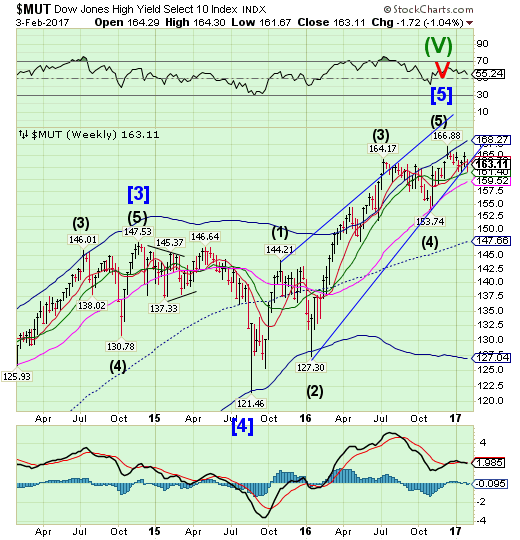
The High Yield Bond Index declined through its Ending Diagonal trendline to bounce off Intermediate-term support at 161.40. High Yield Bonds are on a sell signal. A broken Diagonal trendline implies a complete retracement of the rally may occur. Is this the canary in the coal mine?
The great run for high-yielding corporate debt may be ending, some strategists argue.
The High Yield Corporate Bond (NYSE:HYG) has outpaced the 20+ Year Treasury Bond (NASDAQ:TLT) by more than 11 percent in the last three months, rising nearly 3 percent as the TLT got crushed after the U.S. election. High-yielding bonds are often called "junk bonds," as they carry higher risk of defaulting, along with low credit ratings.
As Erin Gibbs, equity chief investment officer at S&P Global, points out, a significant chunk of the HYG's 1,034 holdings are concentrated in communications; the fund's top-weighted constituents include Sprint (NYSE:S), Western Digital (NASDAQ:WDC) and French telecommunications company SFR Group. Energy names are also highly represented in the fund.
USB may be reversing higher.
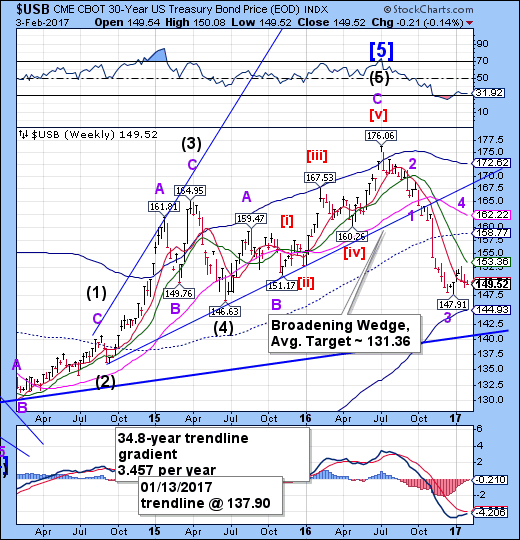
The Long Bond may have put in its Master Cycle low on January 26. If so, the Cycles Model indicates another attempt at mid-Cycle resistance at 158.77may be made in a zigzag formation. The Cycle Model suggests a probable terminal high in the next week or so.
It's an article of faith in the credit markets that certain fundamental forces propel the yields on government debt, specifically economic growth, state spending, inflation and central bank guidance.
Not so, says HSBC Holdings Plc (LON:HSBA) fixed-income analysts led by Steven Major. Instead, high debt levels, demographic forces and wealth inequality overwhelm the traditional forces cited for the feared unravelling of the bond market's 35-year bull run this year.
"We show that many of the common rules of thumb or ‘heuristics’ that are applied to bond yields are simply false," Major wrote in a client note this week.
The Euro rally fizzles.
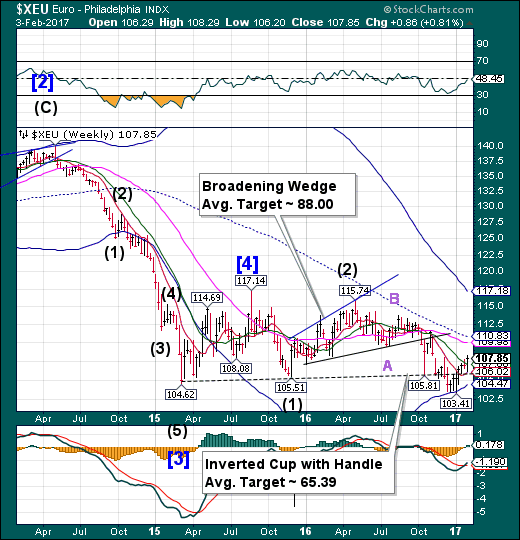
The euro revisited the Lip of the cup with Handle formation before surging above Intermediate-term support/resistance at 107.08. This appears to be the last probe higher, as it is due for a decline in the next week as it ventures toward parity or below.
In an attack on Germany, U.S. President Donald Trump's top trade adviser said the euro was "grossly undervalued", a charge which may ring true for the German economy but not for the 19-member currency zone as a whole.
The adviser, Peter Navarro, said Germany, the euro zone's economic powerhouse, was exploiting the euro exchange rate for trade purposes, a charge rejected by German Chancellor Angela Merkel.
There's no clear method of establishing how much a currency is under or overvalued but many economists think that some economic measures show the German economy could easily cope with a stronger euro. It hit a 14-year low of $1.0339 EURO= last month.
EuroStoxx finds support.
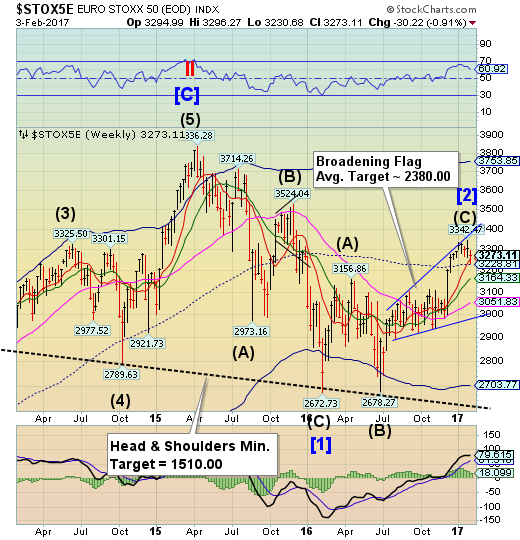
The EuroStoxx 50 Index tested weekly mid-Cycle support at 3228.81 on Tuesday that may be a Master Cycle low. Normally a 2-3 week rally follows. However, the Cycles are compressed, which allows a resumption of the decline much sooner. A decline beneath mid-Cycle support confirms the existing sell signal.
Building on an earlier report that signalled a stronger euro-area economy, the Stoxx Europe 600 Index rose 0.6 per cent to 364.07 in a broad-based rally. Only the basic-resources sector lost ground, with mining stocks dropping along with metal prices following lower-than-expected China macroeconomic data.
The Euro Stoxx 50 Index added 0.6 per cent, moving further away from a key support level representing its 50-day moving average.
The euro-area economy started the year on a solid footing, with rising orders bolstering job creation, according to IHS Markit.
The yen breaks out.
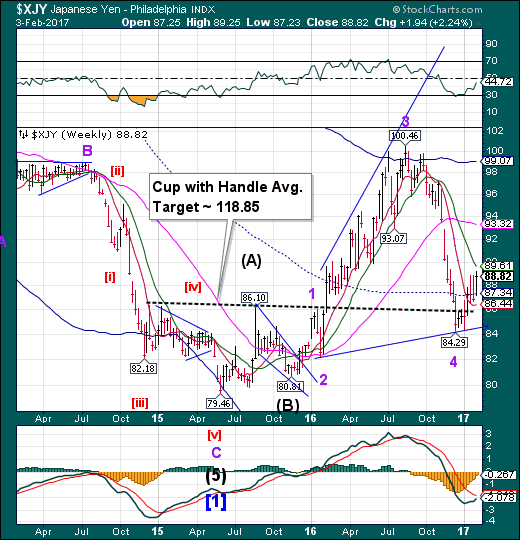
The yen broke out above its three-week consolidation.It may have put in a Master Cycle low at 86.67 on January 27, allowing it to surge higher next week. The strength of the rally may be determined by the yen’s behavior at Intermediate-term resistance at 89.61.
Japan fiercely denied Donald Trump’s claims of yen manipulation on Wednesday as the presidential remarks triggered a slide in the dollar and raised one of Tokyo’s worst fears for the new U.S. administration.
Officials from prime minister Shinzo Abe downwards said Japan had not intervened in the yen for years and respected its G7 and G20 commitments not to devalue the currency for competitive advantage.
Tokyo’s robust response highlights its fear that the Trump administration will target Japan because of yen weakness linked to easy monetary policies of the Bank of Japan.
The Nikkei loses its mojo.
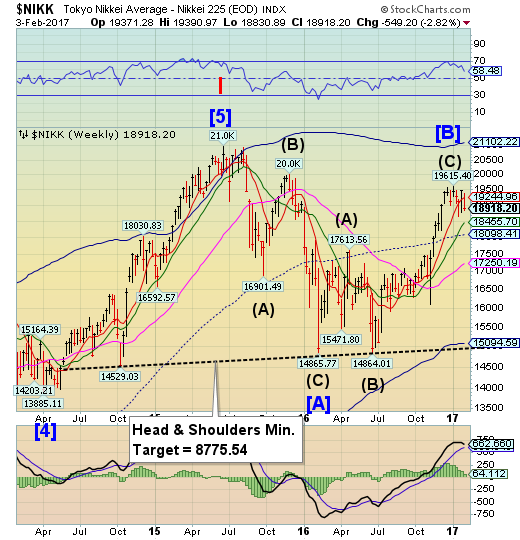
The Nikkei declined beneath Short-term support at 19244.90, reinstating its sell signal. This week’s action left an inside candle that must break below 18650.00 to confirm the sell. A loss of the next supports suggests a potential decline to the Cycle Bottom at 15094.59.
Leaked fuel in a reactor containment vessel is believed to be releasing deadly radiation within the Fukushima Daiichi Nuclear Power Plant, the Nikkei Asian Review reported Friday.
The discovery was made in January when plant operator Tokyo Electric Power Company (Tepco) conducted an inspection of the containment vessel in the No. 2 reactor, Nikkei added. A camera used in the inspection captured images of a 1-square meter hole melted into a walkway below the pressure vessel.
The Fukushima Daiichi plant was badly damaged after a massive quake struck the north-eastern coast of Japan in March, 2011, knocking out its cooling systems and causing a meltdown. However, a recent study showed that radiation levels at the plant were lower than previously expected and plenty continue to live in close proximity to the disaster site.
U.S. dollar has the worst start of the year in 3 decades.
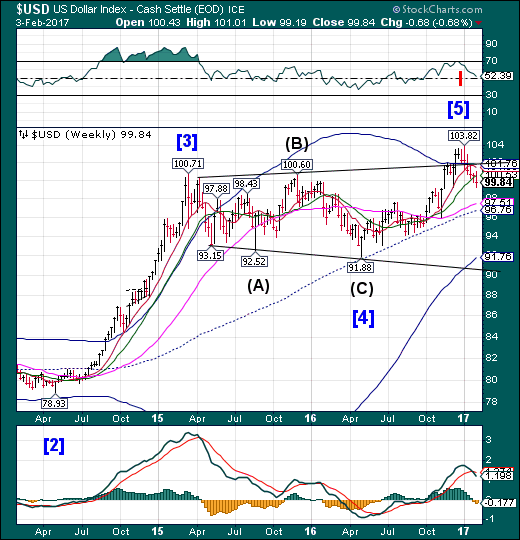
USD continues to decline beneath Intermediate-term support at 101.53,confirming the sell signal. The ensuing decline may continue to be described in superlatives.
Speculators reduced bullish betson the U.S. dollar for a fourth straight week, as net longs fell to their lowest since late October, according to data from the Commodity Futures Trading Commission released on Friday and calculations by Reuters.
The value of the dollar's net long position totaled $18.47 billion in the week ended Jan. 31, down from $20.04 billion the previous week.
The U.S. currency has slumped this year, undermined by the Trump administration's weak dollar rhetoric, driving its worst January performance in three decades. This week was no exception as the dollar continued to trend lower, posting its largest weekly percentage fall in more than six months.
Gold breaks out.
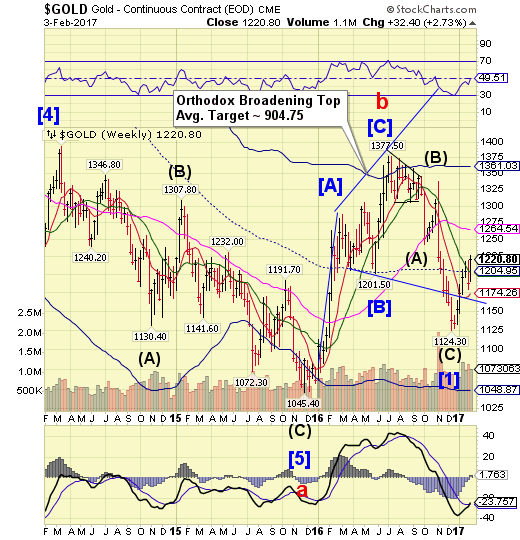
Gold broke out above its mid-Cycle and Intermediate-term resistance to make a new high. It appears that the Long-term resistance at 1264.54, or higher, may be within reach. It may be ready for a spirited rally to its intended target in the next week or so. However, the rally does not appear to be a lasting one.
Gold futures rose, capping the biggest weekly gain in more than seven months, as slower U.S. wage growth eased concern that rising inflation will spur the Federal Reserve to move more aggressively in boosting interest rates.
The jobless rate rose to 4.8 percent and average hourly earnings grew 2.5 percent from January 2016, the weakest since August, a Labor Department report showed Friday in Washington. January’s 227,000 increase in payrolls followed a 157,000 rise in December. The median forecast in a Bloomberg survey of economists called for a 180,000 advance.
Bullion has rebounded in 2017 after the biggest quarterly drop in more than three years, helped by speculation that the Fed will be more cautious in raising interest rates amid uncertainty over the impact of President Donald Trump’s policies. Traders see a 28 percent chance that policy makers will tighten monetary policy in March. That’s down from about 30 percent before the U.S. data was released, Fed fund futures data showed.
Crude continues its narrow consolidation.
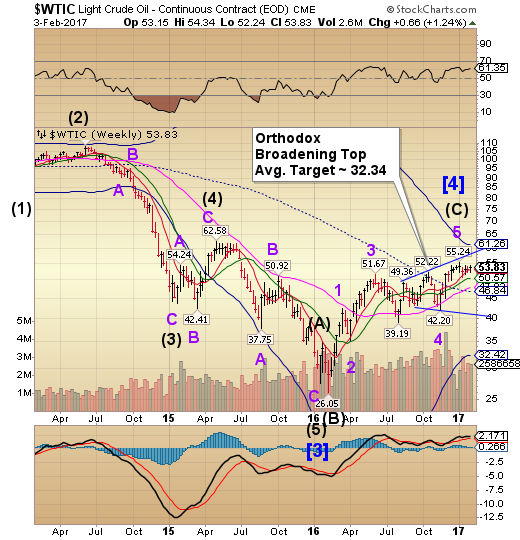
Crude continued its fourth week of a narrow, sideways consolidation after its January 3 high. A decline beneath Intermediate-term support at 50.57 produces a sell signal for crude. The Cycles Model suggests a potential low may be overdue. The Cycles are compressed here, making sudden, dramatic moves highly probable.
Crude oil prices surged in Asian trade on Friday, supported by Reuters report that Donald Trump could execute fresh sanctions on Iran, enhancing prospects for lower Iranian oil exports. Saudi Arabia and the other Gulf States could also support Trump’s decision, amid their rivalry with Iran. According to the Reuters report, the new U.S. administration is all set to impose restrictions against Iran after their ballistic missile test.
Brent crude oil prices surged 0.5% from their recent settlement, while U.S. crude oil increased 29 cents over the prior close.
Although oil prices struggled to make big gains in the last couple of weeks due to the threat of rising U.S. production, Trump’s fresh sanctions against Iran could offer significant support to crude oil prices. Iran has aggressively ramped up their production above 4 million barrels a day since the Obama administration and Iran agreed on a nuclear deal.
Shanghai Index may have slipped through the Pennant trendline.
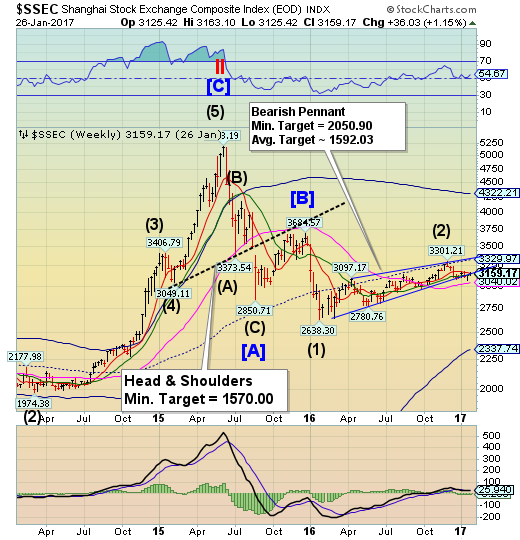
The Shanghai Index may have slipped through its year-long Bearish Pennant formation at 3160.00 as market participants returned from a week-long vacation on Friday. A doubly indicated period of strength may have ended on Friday. The fractal Model suggests the Shanghai is due for another 1,000 point drop. The index is now on a sell signal.
With the yuan suffering its largest annual decline ever and avenues for capital flight surging in value (Vancouver homes and virtual currencies), it is perhaps not entirely shocking that, according to the Institute of International Finance, capital outflows from China surged last year to a record $725 billion. Furthermore, IIF warns, outflows could accelerate further if U.S. firms face political pressure to repatriate profits.
As Reuters reports, the Washington DC-based group, one of the most authoritative trackers of capital movements in and out of the developing world, estimates net Chinese outflows last year were $50 billion higher than in 2015, dwarfing the inflows other emerging economies received.
The Banking Index had an inside week.
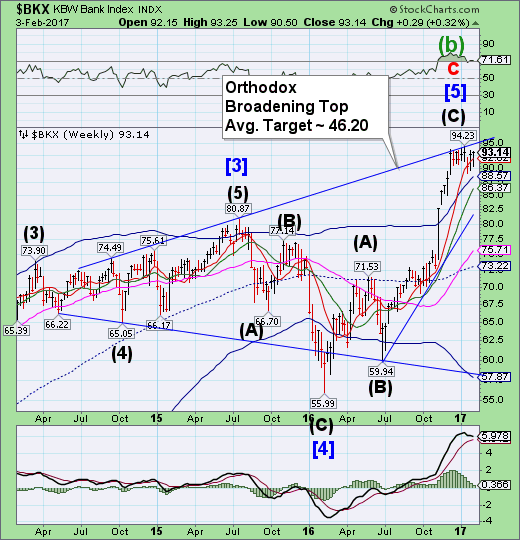
BNK (TO:BKX) attempted a second rally after last week’s retracement, but stayed inside the prior week’s boundaries.It resumes itssell signal under Short-term support at 92.02. The period of strength extended last week, but may have expired on Friday. BKX may embark on a choppy decline through the end of February or early March.
So what do you do if you're a European banking regulator faced with the task of maintaining a safe, sustainable financial system amid a concerning growth in bank leverage. Well, if you said sell down risk assets then you're just being silly or completely ignoring your implicit obligation to engineer higher banking profitability at all costs.
If we can get serious for a moment, like in the early 2000's, when all else fails you turn to synthetic CDO's which, courtesy of some magical, if completely incomprehensible, math, slashes the risk of bank balance sheets while having a negligible impact on profitability. It's called the Synthetic Collateralized Loan Obligation and it's all the rage in Europe.
As previewed earlier today, moments ago President Trump signed two executive orders aimed at starting the process of rolling back the regulatory system put in place after the financial crisis.
Among the targets are rules that protect against predatory lenders, force brokers to lower fees for retirees and ban proprietary trading. Specifically, Trump took executive action ordering the review of Dodd-Frank rules enacted after 2008 financial crisis, and halting the "fiduciary rule" that would require advisers on retirement accounts to work in the best interests of their clients.
The future of cross-border co-operation on bank regulation in the Trump era has been thrown into doubt, with domestic pressure mounting on the U.S. Federal Reserve and a senior member of the House of Representatives calling on the central bank not to negotiate new rules at “secretive” international bodies.
Ralph Hamers, chief executive of Dutch bank ING, told the Financial Times that he feared the U.S. could pull back from a global agreement on banking regulation, which has been delayed because of divisions on the Basel Committee on Banking Supervision.
“We don’t know the position of the Americans any more,” Mr Hamers said. “That does mean further uncertainty and uncertainty is never good, it holds back investment and restricts economic growth.”
