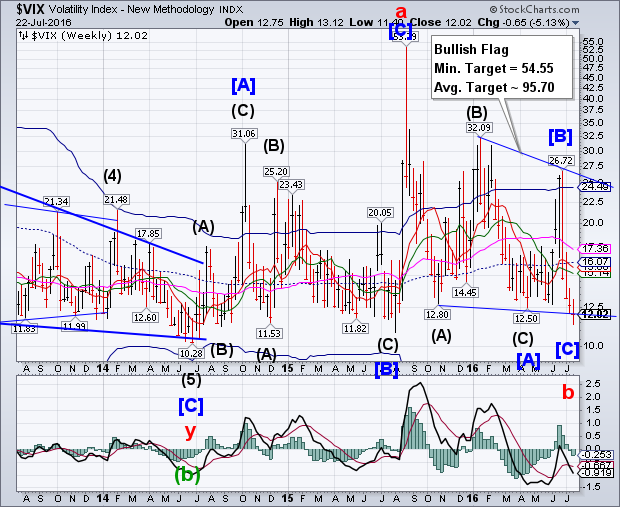
VIX was sold in a throw-under beneath its Bullish Flag trendline, but recovered the trendline at the close of the week.This move may signal the end of the decline in VIX.If so, payback may be coming in a very big way to those who have become complacent.
(ZeroHedge) I have been following several ‘bearish’ ETFs and ETNs lately – ProShares Ultra VIX Short-Term Futures (NYSE:UVXY), VelocityShares Daily 2x VIX Short Term linked to SP 500 VIX Short Fut Exp 4 Dec 2030 (NASDAQ:TVIX), iPath S&P 500 VIX Short-Term Futures Exp 30 Jan 2019 (NYSE:VXX) and ProShares UltraShort S&P500 (NYSE:SDS). All seem to have the following characteristics recently:
After some initial post Brexit selling – they are all seeing steady, if not accelerating inflows
SPX challenges Cycle Top resistance.
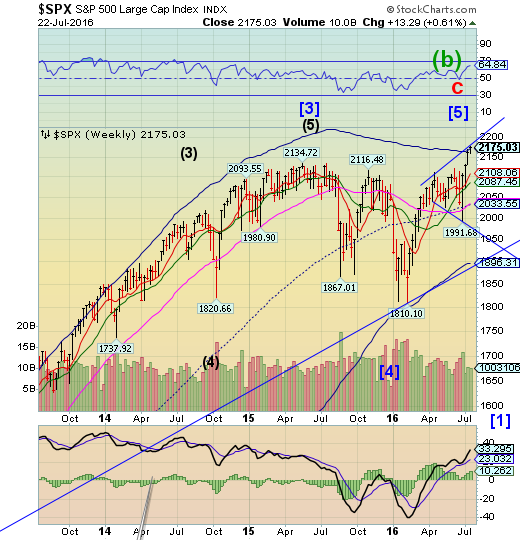
SPX challenged its Orthodox Broadening Top and weekly Cycle Top resistance at 2170.86 by Friday’s close. This is known as a reversal formation from which a decline may begin. A decline beneath Short-term support at 2108.00 may set a new sell-off in motion.
(CNBC) U.S. stocks closed higher for the fourth straight week Friday, with the S&P hitting a new record high as investors waded through mixed earnings and an upbeat U.S. manufacturing report.
The Dow Jones industrial average closed about a quarter of a percent higher as IBM (NYSE:IBM) added the most gains and Apple (NASDAQ:AAPL) had the biggest negative dollar-impact. The blue-chip index notched its tenth positive day in 11.
The S&P closed at a new record level, with utilities leading all ten sectors in the green. The Nasdaq composite ended the day about a half of a percent higher.
Nasdaq 100 is now positive Y-T-D, but .
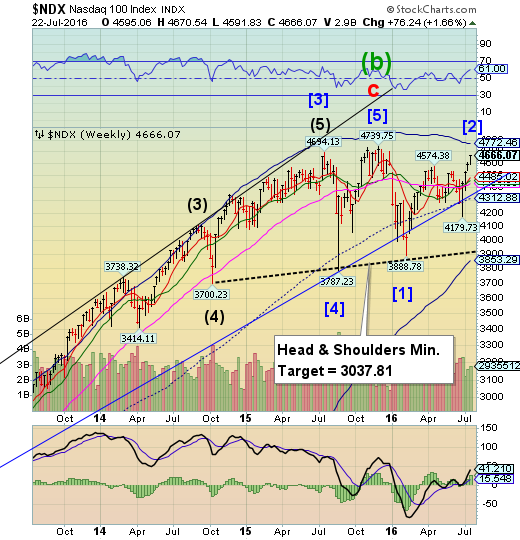
NDX finally turned positive for the current calendar year, but has not exceeded its all-time high at 4739.75.It appears to have completed the right shoulder of the Head & Shoulders formation and may be due to challenge the neckline at 3900.00 in the next two months. This appears to be the end of the summer rally and the beginning of seasonal weakness that may into the month of October.
(Bloomberg) Americans are about as wealthy as they've ever been—and that's a worry?
Yup, say veteran economists Daniel Thornton and Joe Carson. They're concerned that the swelling of wealth could prove unsustainable because it's far outstripped the growth of the economy since the recession's end in 2009.
Thornton, who spent 33 years at the Federal Reserve Bank of St. Louis before retiring in 2014, says in effect that we've seen this picture before. Household net worth ballooned in the late 1990's and the early 2000's; in the first instance pumped up by rising stock prices, in the second by expanding home values. Both cases ended badly, with the economy falling into recession after the bubbles burst.
High Yield Bond Index makes a weekly loss.
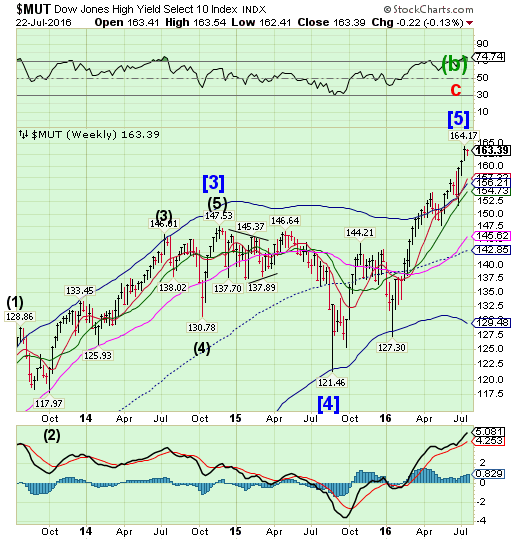
The High Yield Bond Index pulled back from its all-time high. Note that it reacts to the same pivots as equities, making its high on the same day as the SPX. Investors should now be on the alert for a decline beneath its Short-term support at 167.23 for a probable sell signal
(MarketWatch) If you think the stock market has bounced nicely, the junk bond rebound has displayed just as much vigor.
From its recent low on February 11 through July 12, the Bank of America Merrill Lynch (NYSE:BAC) U.S. High Yield Total Return Index is up a blistering 18%. Unfortunately the margin of safety in junk bonds may have disappeared for now.
A good way to think about junk bonds and the risk premium they may offer is to start with the spread, or difference in yield, between them and Treasurys, a putatively safe investment.
USB reverses back inside its trading channel.
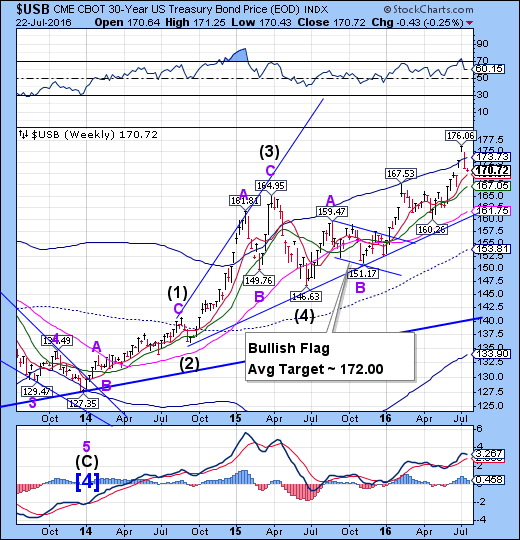
The Long Bond declined through its Cycle Top support at 173.73, stopping just above its Short-term support at 169.07. It may now be due for a retest of the Cycle top at 173.73 in the next two to three weeks.
(WSJ) U.S. government bonds strengthened Thursday as buyers stepped in after the yield on the benchmark U.S. 10-Year Treasury note hit a nearly one-month high.
In late afternoon trading, the 10-year yield was 1.563%, compared with 1.582% Wednesday. Yields fall as bond prices rise.
Government bonds in the U.S. and Germany initially fell Thursday after European Central Bank President Mario Draghi signaled that there is no rush to provide fresh stimulus. Weaker U.S. stocks and crude-oil prices sent fresh buying into haven government debt.
The Eurobreaks down at the neckline.
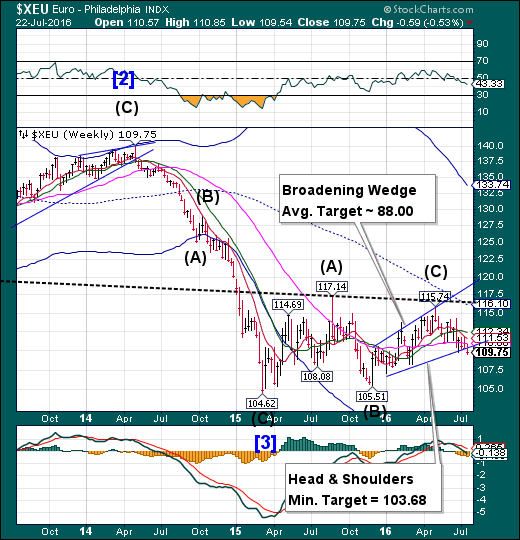
The Eurobroke down through the lower trendline of its Broadening Wedge formation, which also serves as a Head & Shoulders neckline.A break of the trendline now puts the Euro back into a possible bear market with the loss of that key support. The next area for a bounce may be the 104.00 to 106.00 area as it retests it former lows, but the ultimate low may be beneath those benchmarks..
(ZeroHedge) Following disappointingly un-dovish commentary from Bank of England and ECB, it appears a dearth of additional monetary exuberance (over and above the current insanity) is prompting capital flight from Europe. EUR/USD tumbled to a 1.09 handle this morning, near post-Brexit lows..
EUR at post-Brexit lows...
(Ed.)…now beneath post-Brexit lows.
EuroStoxx retests its Cycle Bottom support.
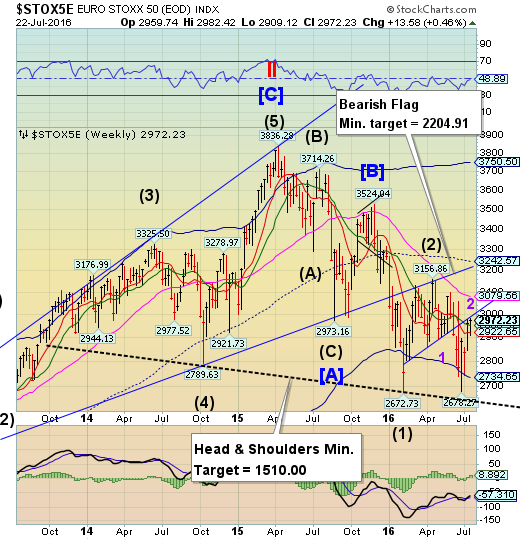
The Euro Stoxx 50 Index launched a rally from its post-Brexit low to retest the trendline of a Bearish Flag formation.The trendis clearly down and the bounce temporarily relieves its oversold condition.A resumption of the decline beneath the neckline at 2600.00.00 maytriggeran even stronger sell-off.
(ZeroHedge) Whether it is due to the recent speculation that Japan may usher in helicopter money, or ongoing concerns about what Brexit may do to the future of European asset returns, there has been a dramatic shift in fund allocation and as Bank of America reports, investors are rushing to vote with their wallets. They have done so in the latest week by continuing to plow money into EM stocks, allocating a record amount of cash to Emerging Markets, while yanking a similarly record amount of cash from Europe.
The Yen bounces off trendline support.
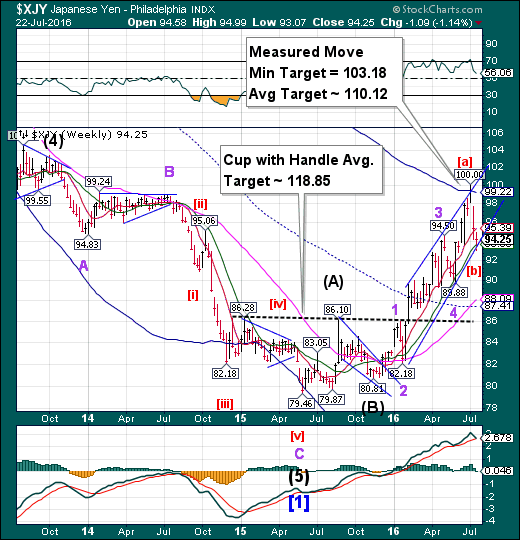
The Yen bounced off trendline support while challenging Intermediate-term support at 93.66.The decline this week also fulfilled a Master Cycle low, suggesting that the Yen may have another go at 100.00 (round number resistance). The probable new period of strength may last through late September. A breakout above the Cycle Top appears to be probable.
(ZeroHedge) The main catalyst that has pushed stocks to new all time highs, and sent the Yen plunging the most in the 21st century last week, were reports that Ben Bernanke was urging Japan to unleash helicopter money. Indeed, just yesterday, the USD/JPY hit new two month highs on reports Japan was considering doubling the previously rumored fiscal stimulus of JPY10 trillion to 20, with the implication that the BOJ would provide the funds. It appeared that Japan had found just the jawboning tagline to keep stocks levitating and the Yen dropped: just hint every other day that more helicopter-funded stimulus is coming and jawbone assets, the same way verbal hints of more BOJ QE worked in 2015.
.The Nikkei 225 makes a second, weaker right shoulder.
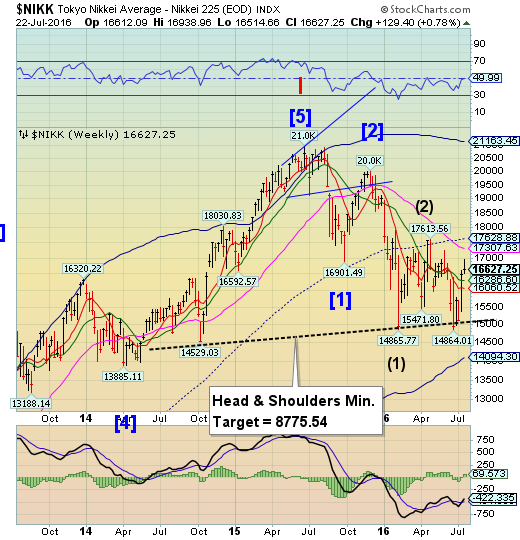
The Nikkei bounced from its Head & Shoulders neckline a second time, forming a weaker second right shoulder. A decline beneath the neckline may bring on the panic phase of the bear market.
(Economic Calendar) The benchmark Nikkei average gapped lower following a sharp drop in USD/JPY on Thursday. The index opened at 16,612 and remained range bound on the day to close at 16,627 for a decline of 1.09%.
USD/JPY topped in Asian trading on Thursday, and gained momentum to the downside in early European trading on speculation of the size of BoJ’s stimulus package. The bank is expected to announce its new monetary policy easing program at their July 27-28 meeting. Prime Minister Shinzo Abe’s meeting with Ben Bernake after the elections sparked speculation that Japan would look to helicopter money in its next round of easing. The speculation had already been dismissed in the same week.
US Dollar Index breaks out above Long-term resistance.
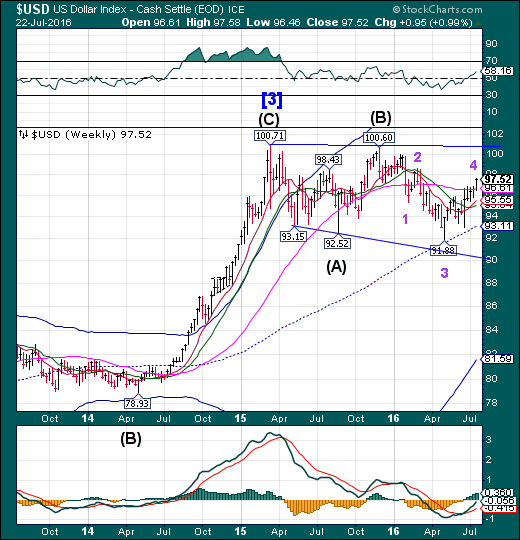
USD broke out above Long-term resistance at 96.61 in a probable Wave 4 extension. The Cycles Model suggests that the period of strength may be over and a probable new decline beginning next week. This could lead to a potential four-week decline. It follows, then, that this may be a false breakout.
(Reuters) Speculators boosted their net long U.S. dollar position this week, to the highest since early June, as investors were encouraged by a spate of strong U.S. economic data that supports expectations of at least one interest rate hike in 2016.
The value of the dollar's net long position increased to $10.42 billion in the week ended July 19 from $8.01 billion the previous week, according to Reuters calculations and data from the Commodity Futures Trading Commission released on Friday.
Gold reverses beneath its Cycle Top support.
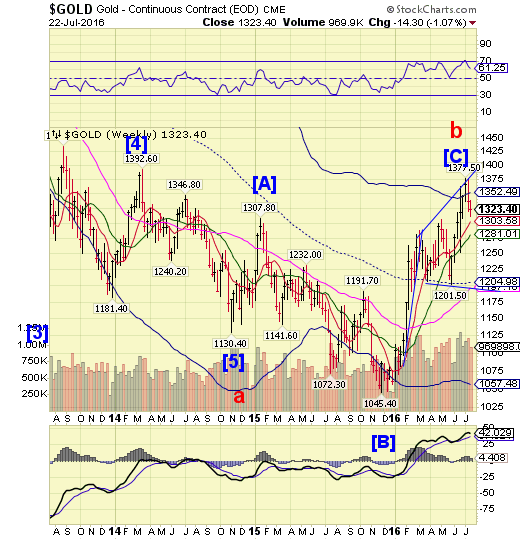
Gold declined beneath its Cycle Top support at 1352.49 and made a brief but unsuccessful stab at a retracement. The retracement may not be over, as it will customarily retest the Cycle Top as resistance. The larger picture is that gold has at least another three weeks of decline ahead. The next two supports must be taken out in order to reach its probable downside target near 1165.00.
(Reuters) Gold prices eased on Friday, reflecting tension between an easier global interest rate backdrop and the chance of U.S. monetary policy being tightened before the end of 2016.
Spot gold shed 0.5 percent to stand at $1,324.66 an ounce at 1011 GMT, on course for a decline of around 1 percent for the week.
Bullion has benefited significantly - hitting its highest in two years earlier this month - as central banks from Europe to Japan opt to keep policy looser for longer, because that neutralizes the opportunity cost of holding an asset with no interest rate.
Crude Oil begins its decline.
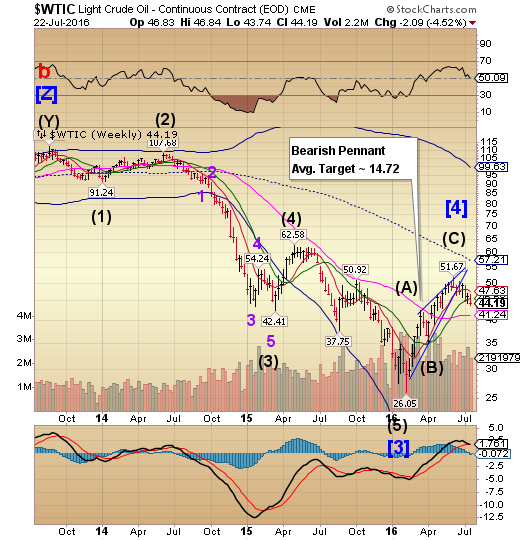
After a skirmish with support and resistance, crude declined beneath its Intermediate-term support at 45.60 this week. The next Trading Cycle low may be in mid-August. It suggests an initial drop to challenge Long-term support at 41.24 with a more substantial decline to follow.
(Reuters) Oil prices settled lower on Friday, losing 4 percent on the week, after the fourth weekly rise in the U.S. oil rig count added to worries about a global crude glut.
Crude futures were already down, with Brent at two-month lows, on fears of more Iraqi supply before a report by energy services firm Baker Hughes showed U.S. oil drillers added 14 rigs this week to bring the total rig count to 371.
"The oil complex is already struggling with oversupply issues. More than ample inventories and upcoming refinery turnarounds and maintenance have the bulls on the defensive," said Pete Donovan, broker at Liquidity Energy in New York.
"An increase in rigs is the last thing they need."
Shanghai Index stopped by mid-Cycle, Long-term resistance.
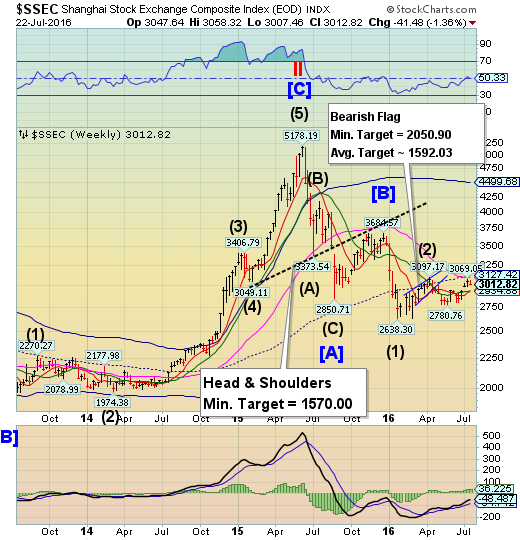
Last week the Shanghai Indexrallied toward its mid-cycle resistance at 3127.42 and Long-term resistance at 3095.24. This week shows a reversal short of reaching either target.The Cycles Model suggests that aa short-term low may be reached next week,with aa longer decline to follow.
(ZeroHedge) Having followed China's biggest risk with great interest for the past year, which incidentally isnot its $36 trillion in debt, nor its defaults, its zombie companies, its ponzi "wealth products", its currency, its capital outflows, its crony capitalism and corruption, nor its gargantuan capital misallocation, but the threat of a social revolution as a result of a surge in unemployment as entire zombie industries fail, that has always been true biggest risk for Beijing (something the Politburo knows very well), we found it less than surprising when last September a Chinese coal company announced it would fires 100,000.
That was just the tip of the iceberg for China's insolvent commodity sector, which just happens to employs tens of millions of no longer needed workers.
The Banking Index rally is stopped at Long-term resistance.
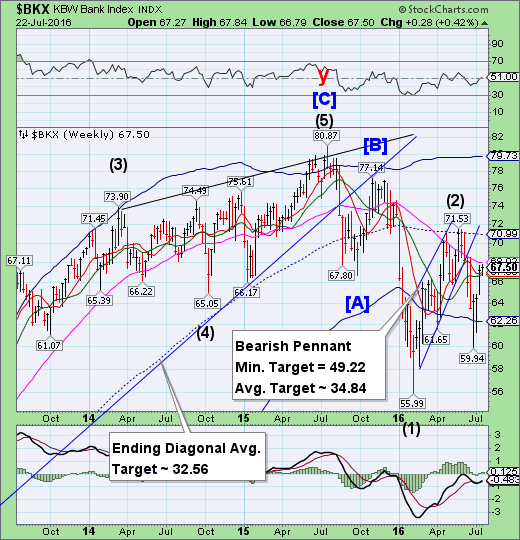
--The BKX rally off the Cycle Bottom stopped short of Long-term resistance at 68.02.The Cycles Model suggests that the period of strength may have run out, leaving the next two weeks in a probable decline.It does not appear that the Cycle Bottom support will stop the ensuing decline..
(ZeroHedge) The last time Goldman raised an private-equity buyout fund was in 2007: at just over $20 billion, it was the second biggest private-equity fund ever. It also top-ticked the market.
Nine years later, the WSJ reports that Goldman is finally preparing a much anticipated sequel.
According to the paper, Goldman will begin marketing a new corporate-buyout fund of between $5 billion and $8 billion, its first such fund since the financial crisis. It is aiming for an initial close by the end of the year, the people said.
With blockbuster LBO deals largely missing from the landscape in recent years, perhaps as a result of record EBITDA multiples and an unwillingness on the side of PE firms to rush into what is clearly record overvalued assets, the effort shows "Goldman’s commitment to a corner of Wall Street that many rivals have abandoned."
(ZeroHedge) If ever there was a reason for more European nations to 'exit' the sinking ship, Mario Draghi just spewed one. Having sent European bank stocks sliding with earlier calls for reforms, Draghi's wishful-thinking sent bank stocks soaring (especially Italian banks) after he noted a "public backstop is a measure that would be very useful and should be agreed with the Commission according to the existing rules." We can only imagine Herr Schauble's face when he heard this... and what about the Dijsselblom "template"?
(WSJ) Big banks are socking away more money to cover possible losses on consumer loans, as their executives warn the long boom in credit quality has peaked.
Lenders including J.P. Morgan Chase & Co., Wells Fargo (NYSE:WFC) &Co.,Capital One Financial Corp (NYSE:COF). and Discover Financial Services (NYSE:DFS) said on earnings calls this month that they have bolstered their reserves—in some cases for the first time in years—to prepare for an uptick in loan losses.
The higher reserves in part reflect efforts to expand loan volume. As competition for borrowers intensifies, some lenders also are lowering credit-score requirements and taking on riskier customers.
(WSJ) Banks’ profit margins on loans are falling again after a brief boost from the Federal Reserve’s rate increase late last year.
Net interest margin, a measure of how much a bank earns from the difference between what it pays on deposits and what it takes in on loans and investments, fell at all six of the largest U.S. retail banks by assets that reported second-quarter earnings this month.
