REVIEW
The market started the week at S&P 500 2047. After a rally to SPX 2072 on Monday, the market worked its way down to SPX 2026 by Thursday. Then an options expiration on Friday closed the week at SPX 2052. For the week the SPX/DOW were mixed, and the NDX/NAZ were +0.95%. Economic reports for the week were again positive. On the downtick: the NY/Philly FED, and the Q2 GDP est. was lowered: +2.5% v +2.8%. On the uptick: the CPI, housing starts, building permits, industrial production, capacity utilization, leading indicators, existing home sales, and weekly jobless claims declined. Next week’s reports will be highlighted by Q1 GDP, Durable goods, and more Housing reports.
LONG TERM: bear market
For the past few weeks we have been noting that the Tech sector (NDX/NAZ) is probably a better indication of the general market than the Cyclical sector (SPX/DOW) due to the strong rally in commodities and commodity stocks. Last week the commodity rally was somewhat illustrated by the recent uptrend in the Transports – it’s strongest since it entered a bear market in late 2014.

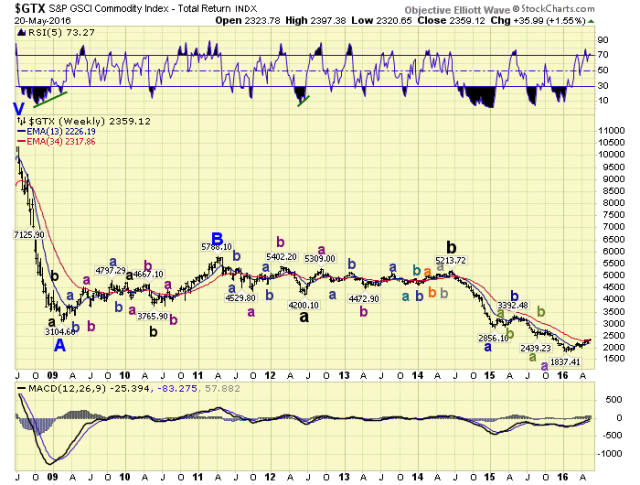
Another illustration of the commodity rally is displayed with the GTX. It too started to advance in January, like the Transports, and has had it best rally since it resumed its bear market in mid-2014. Some suggest commodities have bottomed. Longer term cycles suggest the recent rally is just another uptrend in a volatile bear market.

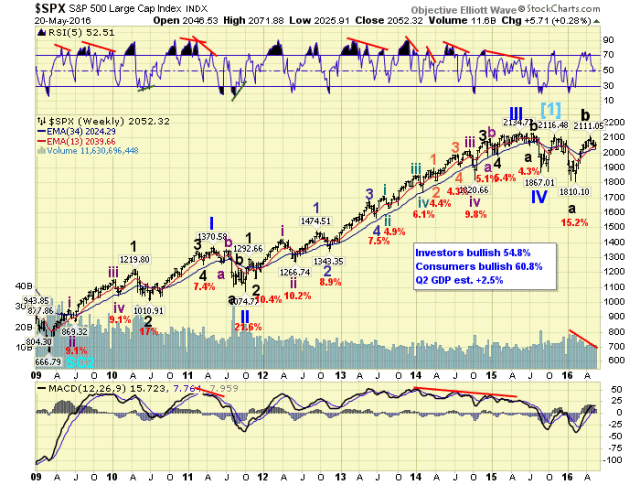
Our count and labeling for the SPX remains unchanged. The bull market lasted from 2009-2015 and completed five primary waves. Primary waves I and II ended in 2011, and Primary waves III, IV and V ended in 2015. After that late-2015 high the SPX declined 15 % for Major wave A, and then rallied nearly back to the high for Major wave B. A Major wave C decline is now confirmed and underway.
We continue to hear there is lots of bearishness, and if everyone has sold then the market has to go higher. Every week we post Investor sentiment right on the weekly chart, and update it monthly. This is an adjusted stock allocation figure displaying what the public is actually doing, verses what they may be saying every week. Since the beginning of 2013 the public has been bullish, and not once has turned bearish. That’s three plus years despite the recent steep corrections.
MEDIUM TERM: downtrend
For the past couple of months we had been counting the first downtrend of this bear market, Major wave A, as a five wave structure. However over the past several weeks we had been noting that the declining waves did not really look impulsive. They looked more corrective, which typically occurs during bear markets. As a result we have been carrying the labeling of the current downtrend, Major wave C, with both impulsive and corrective labels. Since bear markets can unfold impulsively, i.e. 2007-2009, and correctively, i.e. 2000-2002 it usually takes a couple of trends before it can really be determined which pattern fits the new bear market. We think we have seen enough now to make that determination.

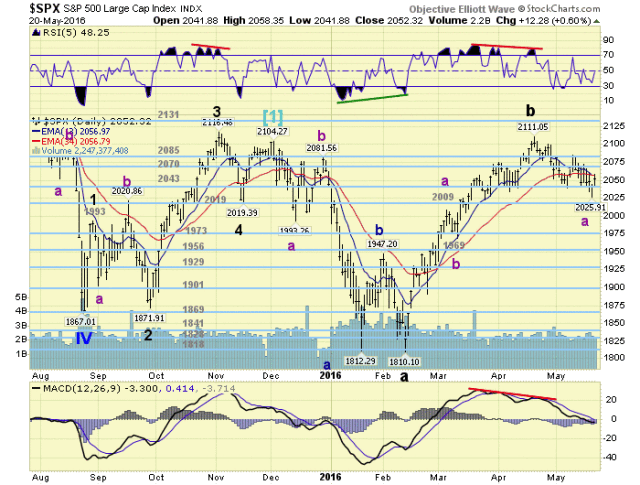
As noted on the daily chart above we are updating the count to display a double three decline for Major wave A. Major wave B remains unchanged as an a-b-c uptrend. Major wave C should now also unfold as a double three to complete Primary A, of a Primary ABC bear market. Major wave A best counts as a small zigzag to SPX 1993, a zigzag to SPX 2082, and then a large elongated flat to SPX 1810. Agree, it is an odd looking pattern. We have, however, recently seen this pattern before and it was indeed corrective. Take a look at Primary wave II during 2011. At first glance it looks like five waves down, but it was not. In fact it looked like the 1987 crash pattern, which tipped us off during 2011 that it was indeed a corrective pattern. The market has apparently discovered a new Elliott wave pattern, and is making good use of it – confusing as many as possible. Medium term support is at the 2043 and 2019 pivots, with resistance at the 2070 and 2085 pivots.
SHORT TERM
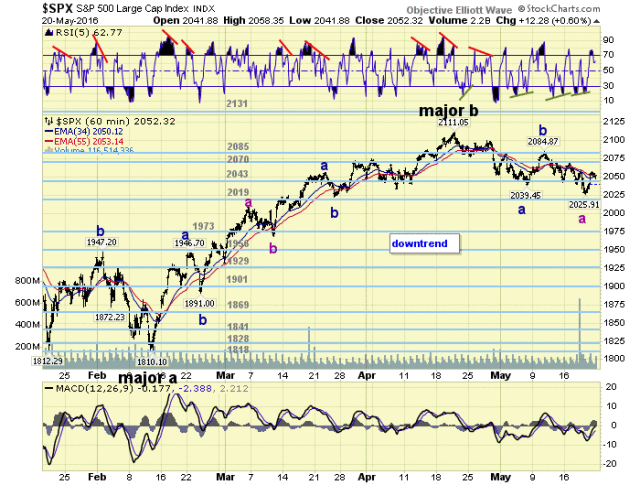
As we have been noting in recent weeks all the activity during this bear market has been corrective. The current downtrend is also unfolding in corrective waves. From the SPX 2111 Major wave B uptrend high the market declined in seven waves to SPX 2039. Then after a nearly straight up rally to SPX 2085 it corrected in another seven waves down to SPX 2026 on Thursday. This seems to be the pattern since the bear market began: seven wave or eleven wave movements for the larger waves.

As a result of this labeling update we have shifted Intermediate wave “a” from the SPX 2039 low to the recent SPX 2026 low. And we are now expecting an Int. wave “b” rally to be underway over the next several days. The upside target is the 2070 pivot range, but we would not rule out a run to the 2085 pivot range too. After it concludes, the recent low at SPX 2026 becomes a critical level. When the market closes below that level the possibility exists for another “waterfall” event. We will keep you updated. Short term support is at the 2043 and 2019 pivots, with resistance at the 2070 and 2085 pivots. Short term momentum ended the week below overbought. Trade what’s in front of you!