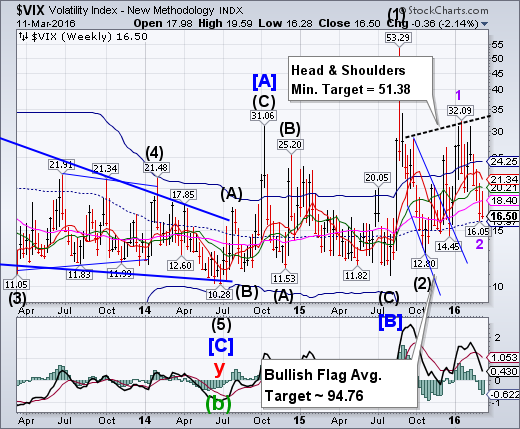
VIX made a wide swing between weekly Intermediate-term resistance at 20.21 and weekly mid-Cycle support at 15.97, but did not make a new low. An aggressive buy signal (NYSE sell signal) may be confirmed with a rise above Long-term support/resistance at 18.40. A breakout above the neckline suggests a very robust follow-through rally that may last several weeks.
(Bloomberg) To see how fast sentiment soured on last year’s momentum winners, look at the options market, where the price of insuring technology stocks against losses is holding stubbornly high versus other industries.
A Chicago Board Options Exchange gauge tracking costs of hedging in the Nasdaq 100 Index is the highest since August versus a similar measure for the Standard & Poor’s 500 Index, according to data compiled by Bloomberg. The ratio of the two gauges sits 11 percent above its seven-year average and is hovering at a level has reached only two other times since the start of the bull market.
SPX closes at the 4.3-year trendline.
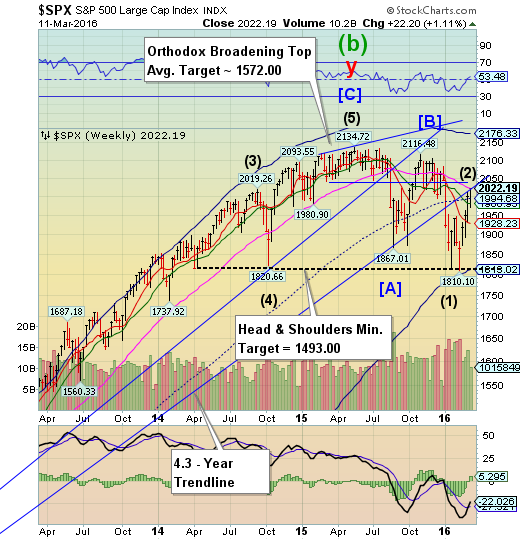
The SPX made another attempt at its 4.3-year trendline at 2022.50 and its Long-term resistance at 22.05, closing between them. This trendline was originally broken on January 6, in the decline to the January 20 low. Trendlines are important support areas that often attract, then repel the markets. A second attempt that meets with a failure may signal a reversal.
(ZeroHedge) While many investors may be breathing a sigh of relief thanks to the bounce off the February low, with the S&P up 11% since the start of February – it’s still not all lollipops and rainbows out there in market-land. There’s some worrying undercurrents that could spell more trouble ahead, not to mention pros like Jeff Gundlach claiming there’s just 2% of upside in the S&P 500 and 20% downside.
NDX ends week beneath Intermediate-term resistance.
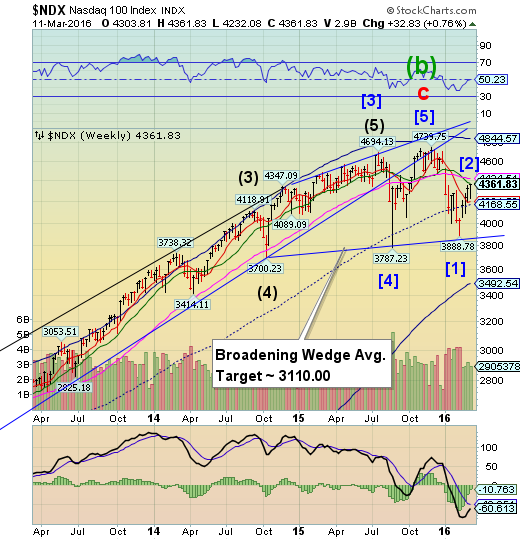
NDX closed a second time beneath weekly Intermediate-term resistance at 4378.61, completing a 55.6% retracement. Should it decline beneath weekly mid-cycle support at 4168.55, NDX may continue its decline to 3000 or lower.
(ZeroHedge) Nasdaq risk is dramatically higher than S&P risk at current levels. Despite the exuberant ramp of the last few weeks, the ratio of Nasdaq VIX to S&P VIX is at its highest in over 6 months.
This is worrisome since the last time Nasdaq traders were this much more concerned about future risk than S&P traders, was right before the August flash-crash collapse...
High Yield Bond Index extends its rally.
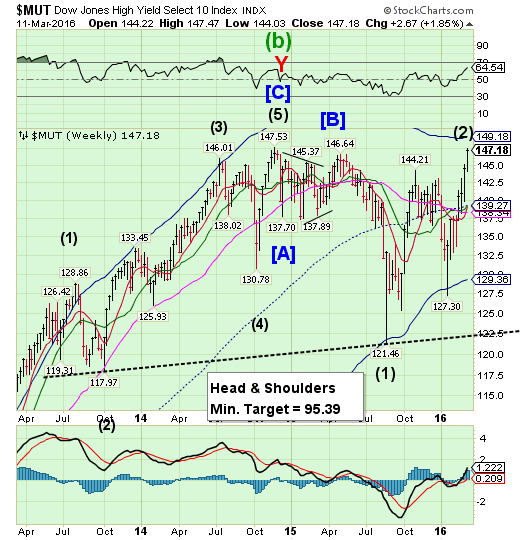
The High Yield Index extended its rally to nearly a 100% retracement of the decline to the August low. The retracement from the next decline may not be as generous.
(USNews) Despite coming off a year with a relatively low number of defaults, weakness in the commodity sectors, particularly in energy and mining, is likely to lead to more defaults in the high-yield market in 2016.
Last year's total defaults represented about 2 percent of the market, while Standard & Poor's estimates the long-term average is 4.4 percent. This year, however, the severe loss in the energy and mining sector could push the total percentage of high-yield bond defaults to 5 or 6 percent of the overall market, says Scott Roberts, co-head of high-yield investments and senior portfolio manager at Invesco in Atlanta.
The euro breaks above its consolidation zone.
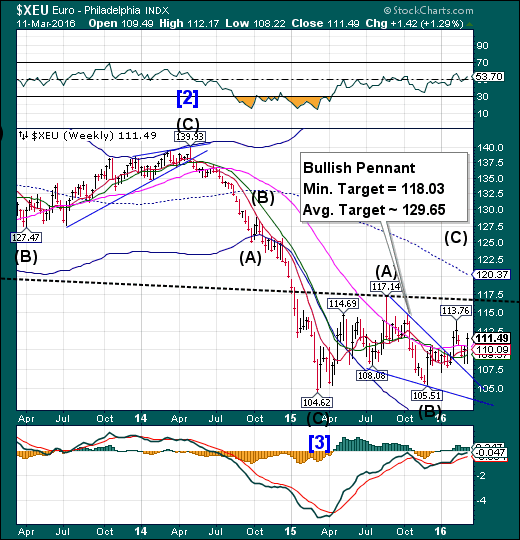
The euro broke above Long-term resistance at 110.45. The Cycles Model suggests a period of strength has begun and may continue through the end of the month with the minimum Pennant target in reach.
(Reuters) If the European Central Bank's latest monetary easing salvo was a surprise in its intensity, then so was the seemingly perverse rise of the euro in response - a move that's left the most bearish currency forecasters scratching their heads.
The euro rallied to its highest in almost a month against the dollar, surging as much as four cents at one point, confounding those who had bet negative interest rates and billions of euros of extra stimulus would send it lower.
This has echoes of the yen's surge since the Bank of Japan's surprise move to negative interest rates on bank deposits in January and raises questions over the effectiveness of central bank stimulus, no matter how aggressive or surprising it may be.
EuroStoxx challenges resistance.
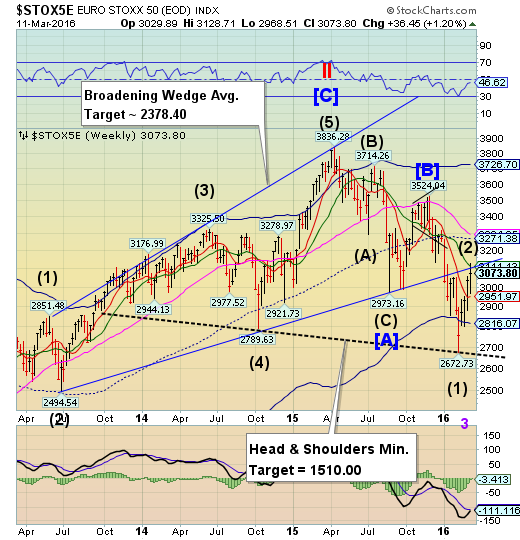
EuroStoxx challenged the trendline of the Broadening wedge formation and Intermediate-term resistance at 3111.13 before closing lower. Failure at these resistance levels may signal a change in trend, while crossing beneath Short-term support at 2951.97 reinstates a probable sell signal. The Head & Shoulders neckline defines the potential magnitude of the decline..
(Bloomberg) Europe’s stocks bounced back, recovering from Thursday’s losses, as traders reassessed Mario Draghi’s expanded stimulus package versus his signal that it might be the end of interest-rate cuts.
The Stoxx Europe 600 Index climbed 2.6 percent to a six-week high, boosted by gains in financial firms and automakers. On Thursday, after an initial surge when the ECB announced it lowered its key interest rates and expanded its bond-buying program, the gauge erased all of its increase when Draghi said he didn’t anticipate further rate cuts. Germany’s DAX Index, among the most hurt in this year’s selloff, jumped the most since August on Friday.
The yen is still consolidating.
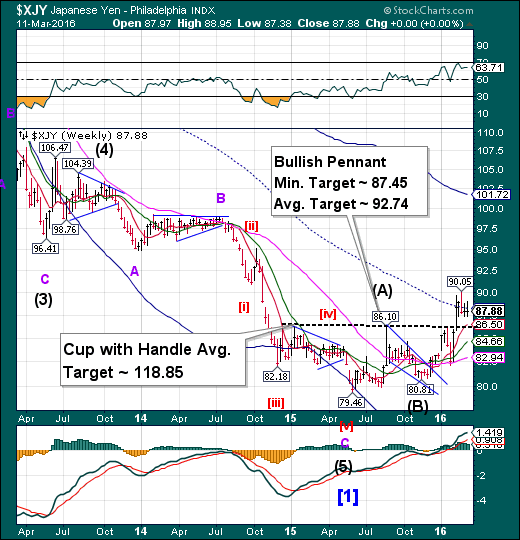
The yen continued to consolidate in a narrow trading range. The expected strong period of strength this week did not materialize. There is expected to be another probable episode of strength as it approaches the end of March. The yen may pull back to its trendline before reversing higher into the end of the month.
(Bloomberg) Hedge funds and other large speculators increased wagers on yen strength to the highest in eight years before the Bank of Japan meets to discuss monetary policy next week.
Positions that profit from gains by the currency exceeded those that gain from a slump by a net 64,333 contracts in the week ended March 8, a report from the Commodity Futures Trading Commission showed Friday. That’s up from 59,625 contracts a week earlier.
The Nikkei rally fails to make a new high.
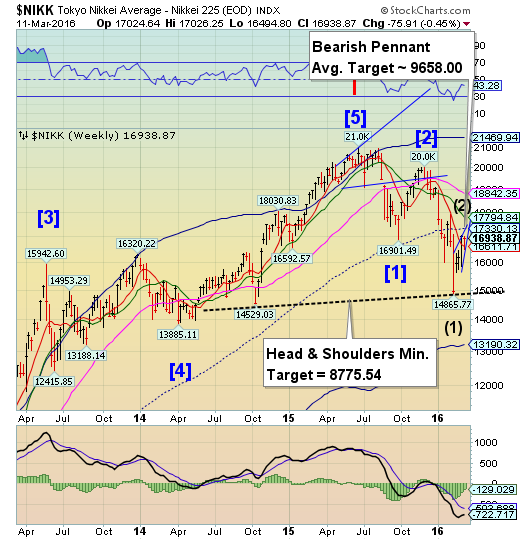
The Nikkei retracement stalled beneath mid-Cycle resistance at 17330.13 without making a new high this week. The Cycles Model suggests that the rally may be over with approximately two weeks of decline ahead. Crossing the neckline may be instructive regarding its ultimate target.
(Reuters) Japanese stocks rose on Friday as a weaker yen boosted the profit outlook for exporters while a bounce in global oil prices improved risk appetite.
Trade was choppy, with the Nikkei share average trading in negative territory earlier.
It swung into positive territory after a bounce in the dollar against the yen offset earlier negative sentiment triggered by European Central Bank's suggestion it was running out of room for further interest rate cuts.
The Nikkei gained 0.5 percent to 16,938.87. but the benchmark index fell 0.4 percent over the week.
U.S. dollar breaks below its Long-term support.
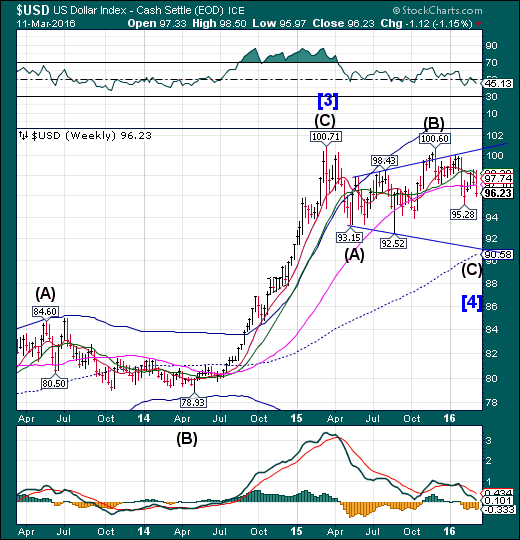
USD broke its consolidation pattern by declining through Long-term support at 97.10. The Cycles Model suggests along decline may follow, lasting through mid-May. It may finally turn traders bearish the dollar. The ultimate target for USD may be the weekly mid-Cycle support at 90.58.
(Reuters) Speculators pared bullish bets on the U.S. dollar, with net longs falling below $10 billion for a fourth straight week, according to Reuters calculations and data from the Commodity Futures Trading Commission released on Friday.
The value of the dollar's net long position declined to $6.88 billion in the week ended March 8, from $7.45 billion the previous week.
The U.S. February jobs report last week showed a drop in wages overshadowed strong jobs growth, feeding views the Federal Reserve was in no hurry to hike interest rates. The dollar weakened, and its poor performance continued early this week as concerns about weak Chinese data spurred safe-haven demand for the yen and Swiss franc.
So far in March, the dollar index was down 2 percent, on track for its weakest monthly performance since last April.
USB extends its retracement.
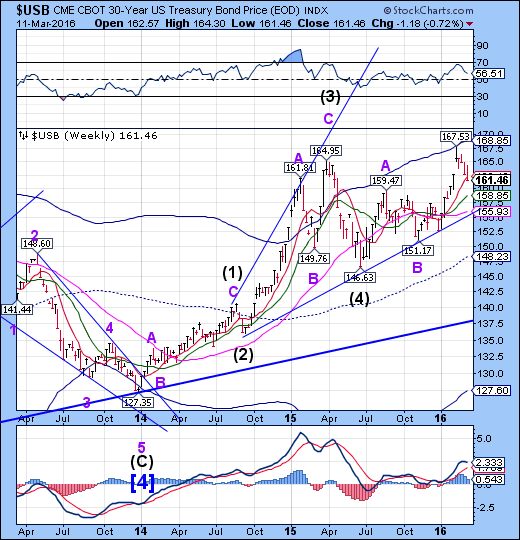
The Long Bond extended its retracement to challenge Short-term support at 162.19. The pullback may be a prelude to a very strong probe to or above the Cycle Top, due by the end of March. Over the next several weeks we’ll be looking for the 34.4-year high in Treasuries. The short Treasuries trade should be worried about the coming rally.
(ZeroHedge) Earlier this week, when looking at the rapidly fraying dynamics in the all-important Treasury repo market, we explained that as a result of the unprecedented, record shortage of underlying paper, the repo rate for the 10Y has plunged to the lowest on record (and even surpassing it on occasion), the -3.00% "fails" rate, an unstable, broken state characterized by a surge in failures to deliver and receive, when one party fails to deliver a U.S. Treasury to another party by the date previously agreed by the parties. Think of it as a margin call issued on a stock in which the responsible party refuses to comply, and is instead slapped with a token penalty, or "fails" fee.
This is precisely what has been going on with the Treasury market for over a week, ever since last Friday when we first pointed out the precarious collapse in the repo rate on the 10Y - traditionally the best indicator of stress in lending markets.
Gold broke out higher.
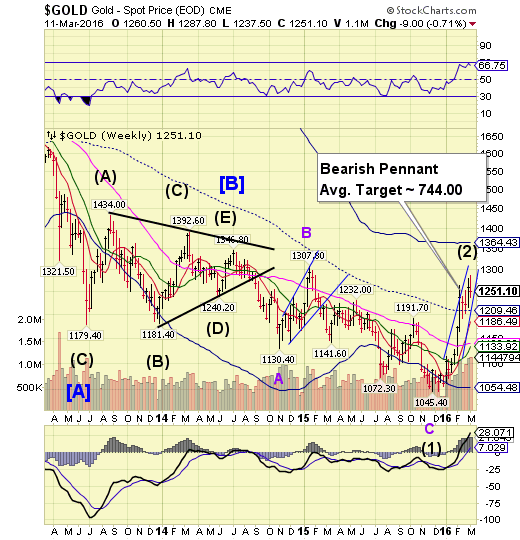
Gold broke out to a new high at 1287.80. However, the breakout stayed beneath 1300.00, as indicated last week. In addition, the period of strength may have run out this week. A reversal may be indicated by declining beneath this week’s low at 1237.50. Once complete, Ending Diagonals are completely retraced, leaving this move as a potential false breakout within the downtrend.
(CNBC) Investors can't seem to get enough of gold this year.
As gold has seen its best start to the year since 1974, exchange-traded funds that track the metal have surged in popularity. According to Stacey Gilbert of Susquehanna, long unlevered gold ETFs have already seen $7.3 billion in inflows this year.
"It is definitely a fan favorite this year," Gilbert said Thursday on CNBC's "Power Lunch." "Just to put in perspective of when we've seen those flows in the past — two months into the year — it was 2009."
Crude challenges resistance.
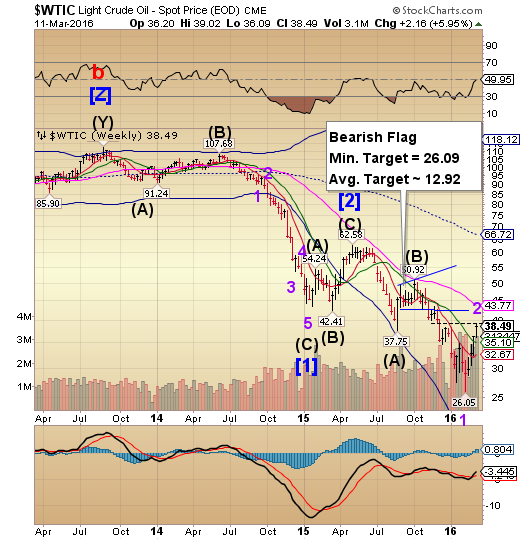
Crude challenged a resistance area at 38.50, but closed beneath it for the week. The Cycles Model suggested that the period of strength might only last until mid-week, but the high was made on Friday. Crude may resume the decline through late March, with Cycle Bottom Support continuing to fall away at 15.31,lending support to the average target analysis of the Bearish Flag. Analysts won’t be calling for a bottom when it finally arrives.
(BNN) A global energy watchdog believes oil prices might have bottomed out. After a remarkable bounce since mid-February, the International Energy Agency says a host of factors are driving oil prices higher.
Most importantly, production is falling in non-OPEC nations and there’s hope for output restraint among other producers. All told, the agency says there’s finally some light shining at the end of a “long, dark tunnel.”
Still, analysts cautioned that a large physical glut remained, with Goldman Sachs (NYSE:GS) warning that U.S. crude could saturate storage in coming months.
Shanghai Index maintains a sideways consolidation.
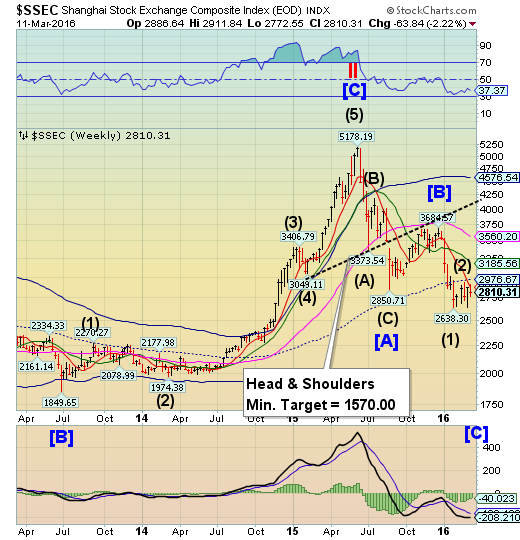
The Shanghai Index remained in a sideways consolidation above its January 27 low, inside its month-long trading range. This week appears to have a double Primary Cycle Pivot, suggesting a decline through the month of March may follow. The Cycles Model calls for a decline that may shock investors.
(Reuters) China's central bank is preparing regulations that would allow commercial lenders to swap non-performing loans of companies for stakes in those firms, two people with direct knowledge of the new policy told Reuters.
The new rules would reduce commercial banks' non-performing loan (NPL) ratios, and free up cash for fresh lending for investment in a new wave of infrastructure products and factory upgrades that the government hopes will rejuvenate the world's second-largest economy.
NPLs surged to a decade-high last year as China's economy grew at its slowest pace in a quarter of a century. Official data showed banks held more than 4 trillion yuan ($614 billion) in NPLs and "special mention" loans, or debts that could sour, at the year-end.
The Banking Index has an “inside” week.
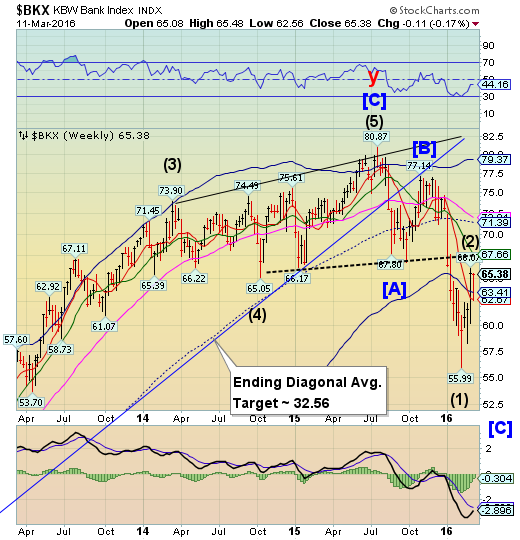
BKX had an inside week, bouncing off its Short-term support at 62.67, but not capable of a new high. The Cycles Model now suggests a probable three week decline that may exceed this year’s initial decline..
(WSJ) Mario Draghi is worried about eurozone bank profits after all.
The European Central Bank president said in January that it wasn't his job to protect banks and on Thursday insisted that loose policy had so far helped not hindered their profits. But the ECB’s big policy moves contained special tricks designed to protect banks against the debilitating effects of negative interest rates.
Investors were initially confused: bank shares rallied then fell back on Thursday. But bank stocks then rose sharply Friday, especially those of southern European banks.
(NYTimes) A new approach to managing China’s corporate debt burden may offer temporary relief for banks but spell further difficulties for the country’s economy: having deeply troubled companies use stock to pay overdue loans.
Early evidence of the strategy emerged late Thursday, when a heavily indebted Chinese shipbuilder disclosed that it would issue equity to its creditors, instead of repaying $2.17 billion in bank loans.
If Chinese companies were to broadly adopt the approach for their debt issues, banks could temporarily shore up their balance sheets by replacing troubled loans with shares that have at least some value. But accepting stakes in highly indebted companies is likely to make banks even more reluctant to shut them down.
And that could mean China will be stuck with enormous overcapacity in industrial sectors including shipbuilding, steel and cement, hampering economic growth for years to come.
(ZeroHedge) Liquidity worries are so 2015.
In the new year, there are much more pressing concerns. Like a possibly imminent, overnight yuan float, which would quite simply torpedo every risk asset on the planet even as it would probably be just the thing Beijing’s economy needs to secure long-term stability.
And then there’s crude prices which, when you strip out the volatility and near daily OPEC headline hockey, are poised to remain suppressed in perpetuity (don’t get lost in the daily melee, this is a story about fundamentals, and from a fundamental perspective, the outlook is bearish - just look at storage overflow and Iranian supply). That means the global deflationary impulse is likely to persist and that, in turn, translates to more central bank meddling and less liquidity.
The funny thing is, although the punditry has apparently forgotten about liquidity, the issue now looms larger than ever because the junk bond liquidation is upon us, and that's just the start of what's ultimately going to be a bursting of the entire financial asset bubble central banks have inflated since 2009. HY is just ground zero for liquidity issues, and make no mistake, you're going to see this take center stage in the months ahead.
