Equities
Commodities
Chart 5: Hedge funds exposure to commodities remains minimal
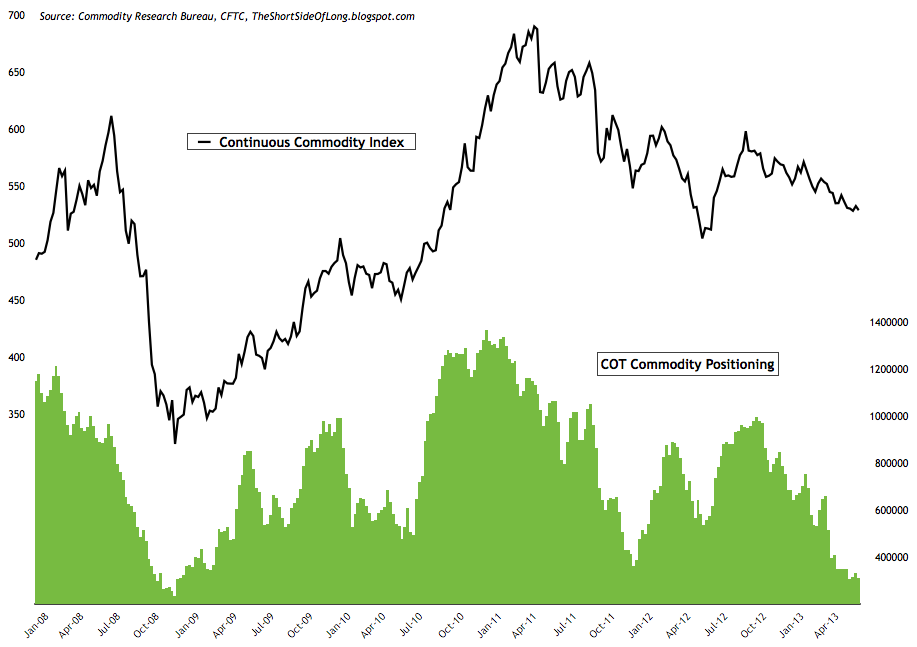
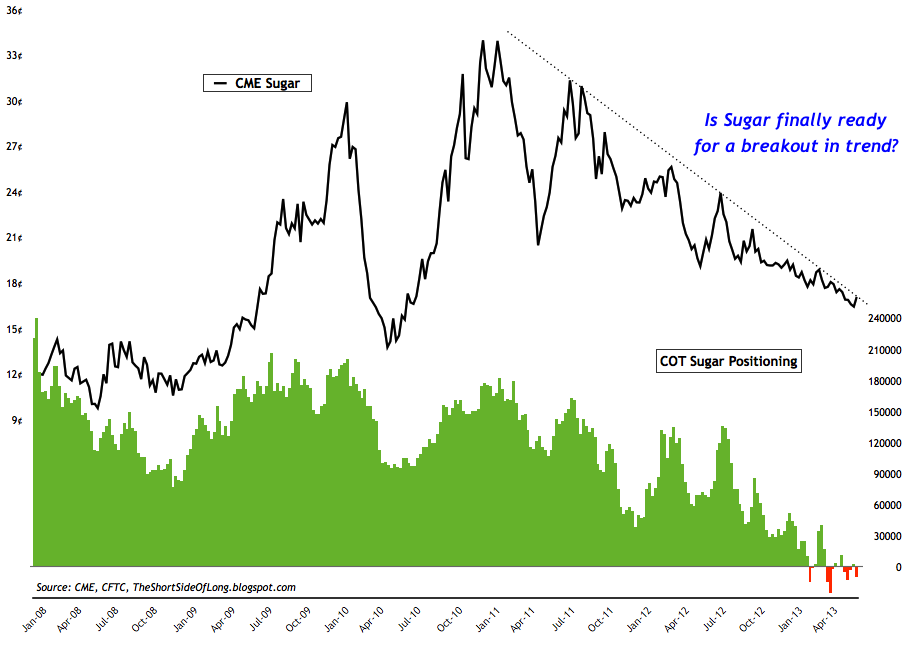
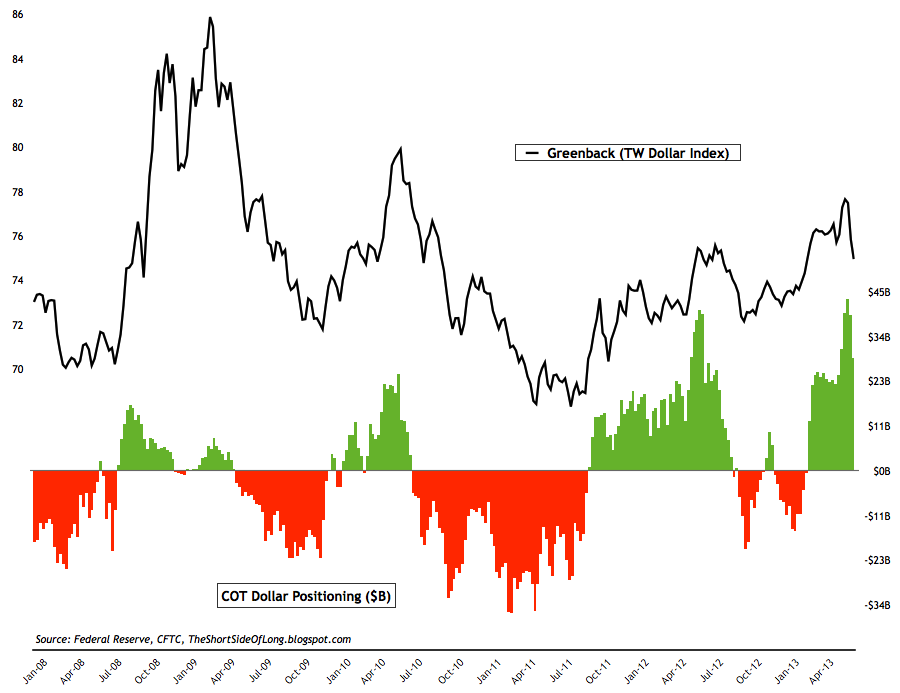
Chart 7: Hedge funds are cutting their record bullish bets on the buck
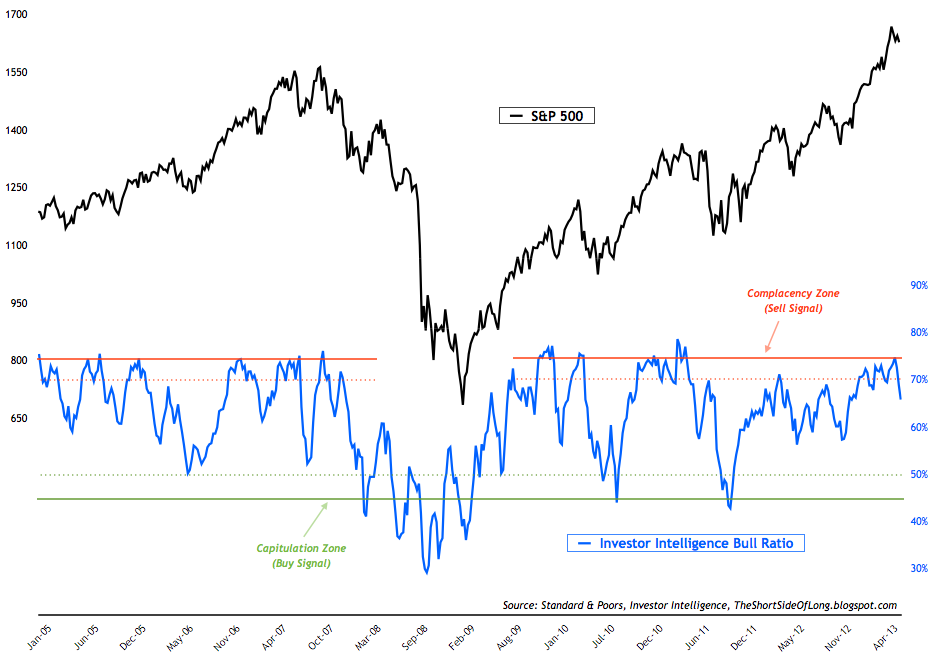
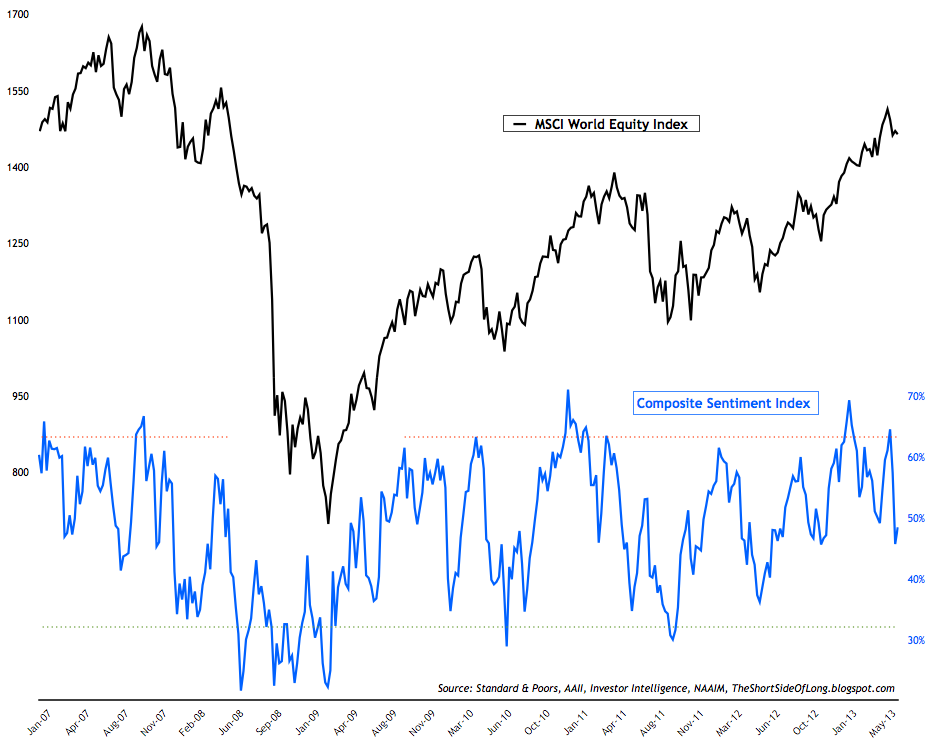
- With stock market correction still in progress, sentiment has changed in recent weeks. Without further ado, let us cover this week's conditions. This week's AAII survey readings came in at 33% bulls and 35% bears. Bullish readings rose by about 3% while bearish readings fell by more than 4%. The bull ratio (4 week average) currently stands at 54%, neither a "sell" nor a "buy signal". For referencing, recent chart of the AAII bull ratio chart can be seen by clicking here. Moreover, recent AAII Cash Allocation survey chart can be seen by clicking here.

- Investor Intelligence survey levels came in at 44% bulls and 23% bears. Bullish readings fell by 2%, while bearish readings increased by 2%. After giving a "sell signal" for quite a few weeks in May, the II bull ratio has now started to mean revert. Having said that, we are no where near a contrarian "buy signal" and the uptrend has become suspect.
- NAAIM survey levels came in at 62% net long exposure, while the intensity remains at same levels to last week, 75%. This sentiment survey remains in a neutral territory as well, indicating that sentiment has reverted back from frothy levels seen during late April and early May. For referencing, recent NAAIM sentiment chart can be seen by clicking here.

- Other sentiment surveys still remain near the "sell signal" territory, despite the recent pull back in stock prices. Consensus Inc survey & Market Vane survey remain at elevated level associated with previous market tops. The same can be said for the Hulbert Newsletter Stock Sentiment surveys, even though they have pulled back from frothy levels seen few weeks ago. For referencing, recent Consensus Inc survey chart can be seen by clicking here.
- This weeks ICI fund flows report showed "equity funds had estimated outflows of $942 million for the week, compared to estimated outflows of $1.00 billion in the previous week. Domestic equity funds had estimated outflows of $2.52 billion, while estimated inflows to world equity funds were $1.58 billion." This is the first time in over a quarter that mutual funds are experiencing a "net" outflow on global bias. On the other hand, Rydex fund flows remain near extreme levels. Leveraged funds still remain extremely popular by retail investors. For referencing, recent Nova Ursa fund flow chart can be seen by clicking here.

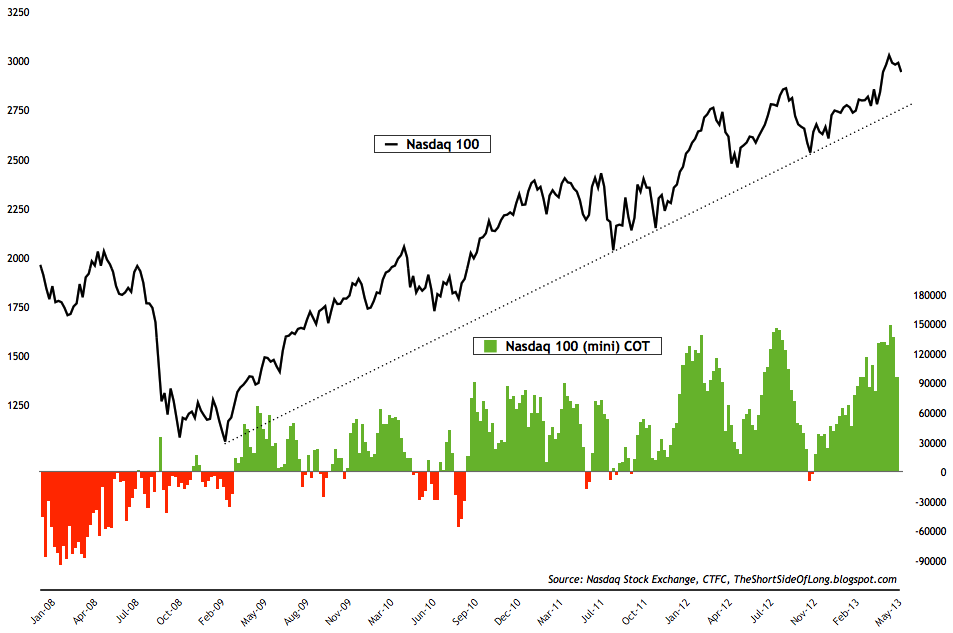
- Confirming the recent pullback in sentiment surveys, this weeks equity commitment of traders report showed that hedge funds and other speculators dramatically cut their bullish on US technology stocks. While the exposure still remains high at over 96 thousand contracts, we are no where near the extremes seen only a few weeks ago.
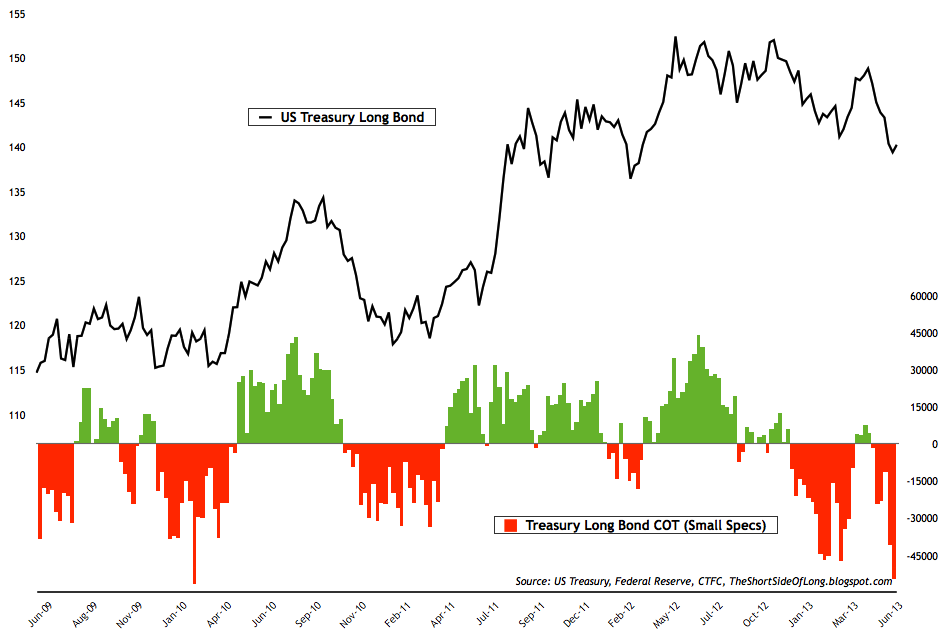
- Bond sentiment surveys continue to pull back with recent selling action and are nearing pessimistic territory. Not all of the surveys confirm each other (as is mainly the case), with Market Vane survey & Hulbert Newsletter Bond survey remaining in the middle of their historical readings, while Consensus Inc survey is approaching extreme downside levels.

- This weeks commitment of traders report shows that small speculators pushed their net short bets on the Treasury Long Bond even further. When it comes to the futures positioning, there is an extreme bearish position built on all matures, from the 2 Yr Note all the way to 30 Yr Bond. From a contrary point of view, this could mean that bonds are poised for a rally. However, if the market does not bounce, it could be a sign of further selling ahead. In a recent newsletter, Jason Goepfert from SentimenTrader summed it up perfectly by stating that:
Commodities
Chart 5: Hedge funds exposure to commodities remains minimal

- Latest commodity commitment of traders report showed that hedge funds and other speculators remain virtually unchanged for weeks on end. Cumulative net long exposure remains around low to mid 300,000 contracts, which is pretty much as low as the bottom in early 2009. Agricultural exposure decreased, with grains rising slightly and softs bullish bets collapsing dramatically. Energy bets were increased this week, while metal bets were mixed.

- Technically, Sugar looks ready to finally break out of its prolonged downtrend. The end of the bear market could finally be upon us. The negative performance in this commodity has lasted for years and now the bearish trend looks exhausted. The final confirmation will be the break of the current downtrend line in place since early 2011. Public Opinion on Sugar is still extremely negative, while hedge funds and other speculators remain net short the soft commodity. We could see a huge short squeeze if price rallies and positions build back towards 120,000 net long contracts. Keep an eye out on Sugar!
- Commodity Public Opinion surveys continue to show somewhat of a bearish tendency, however there are only a few extremes worth mentioning. Similar to last week, investors seem to be negative on Copper, Cattle, Coffee, Lumber, Sugar and Wheat. As we can see, majority of the negativity is towards Agriculture, something that I am extremely optimistic on!
Chart 7: Hedge funds are cutting their record bullish bets on the buck

- Latest currency commitment of traders exposure towards the US Dollar has dramatically decreased from previous couple of week record setting run. Cumulative Dollar positioning now stands just slightly above $28 billion, which is a dramatic squaring of bullish bets from $43 billion seen two weeks ago. Nevertheless, it is worth noting that hedge funds hold short bets on every single G-10 currency in the Trade Weighted Dollar Index, apart from the Kiwi Dollar, something that has been in place for months. Regular readers of the Short Side Of Long newsletter, would remember my warning in Issue 6, where I stated that:
- Currency Public Opinion survey readings on the US Dollar have now mean reverted to more neutral levels. At the same time, Public Opinion on the foreign currencies has also risen from extreme negative levels. As expected, investors are now squaring their US Dollar positions, after being caught on the wrong side of the trade.

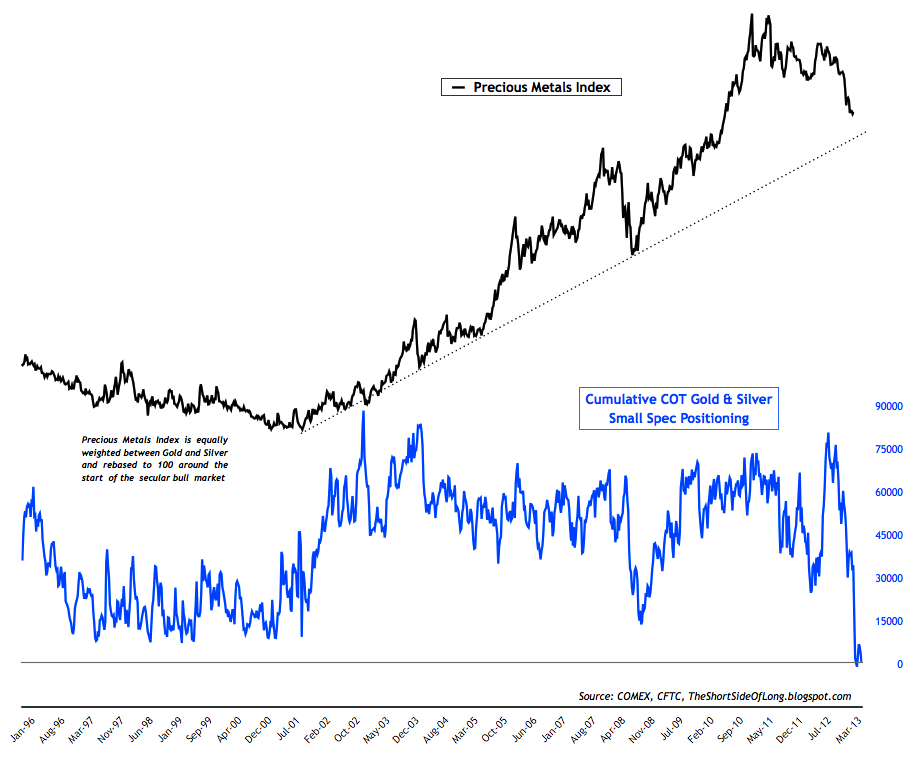
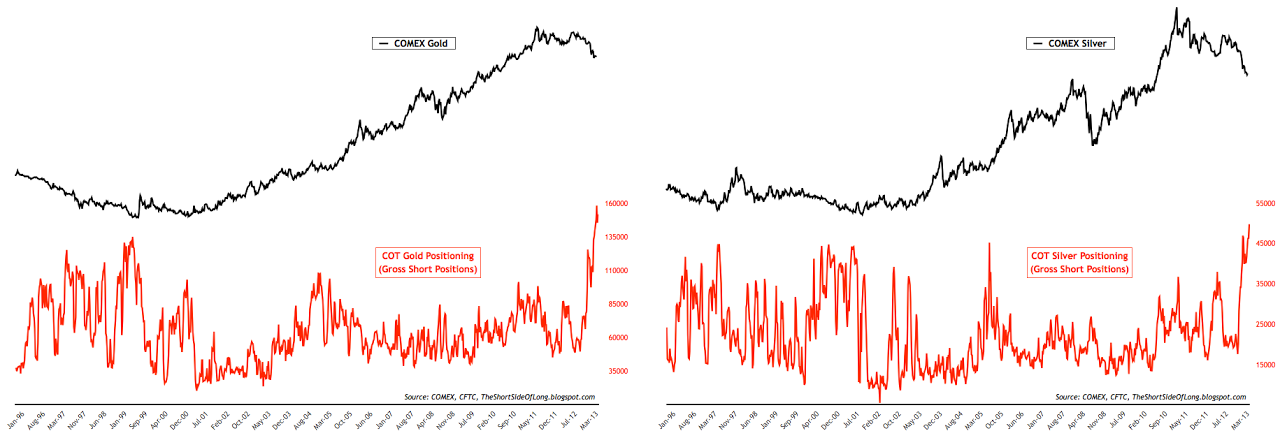
- Alternative currency commitment of traders report showed hedge funds and other speculators remain extremely underexposed towards the precious metals sector. Hedge fund positions on Gold remain at very low levels of 59 thousand bullish contracts, while in Silver positioning are at some of the lowest ever at only 3,700 contract level. Let me say that Silver net long positions as a percentage of open interest are now less then 4%! Moreover, the chart above shows that small speculators, usually considered dumb money, are cumulatively net short Gold and Silver market. If there ever was a buy signal... this is it!

- Furthermore, I would like to highlight the fact that gross short bets are at or near record highs for both Gold and Silver. When we observe hedge fund positioning, we can conclude that there has never been this much pessimism and expectation of lower prices ahead. We are truly in a "precious metals hate" environment.
- Public opinion on alternative currencies like Gold and Silver continues to remains depressed, confirming the COT reports and charts seen above. Outright bearishness and despair remain the correct phrases to be used when describing this sector... a perfect condition for a contrarian investor.
3rd party Ad. Not an offer or recommendation by Investing.com. See disclosure here or
remove ads
.
