- Dovish Fed, trade war progress, earnings all boost U.S. stocks for strong January
- Yield curve flattens
- Dollar about set to top out
- Oil bottoms on sharp rig count drop
U.S. equity markets finished mostly in the green on Friday with the Dow Jones Industrial Average, S&P 500 and Russell 2000 each edging higher to close the trading week. Thursday's Apple (NASDAQ:AAPL) relief rally and the boost in investor sentiment brought on by Powell's characterization on Wednesday of a more "patient" Fed regarding rate hikes helped extend the advances.
As well, investors were buoyed by a strong nonfarm payrolls beat and apparent headway in trade negotiations. According to reports, U.S. President Donald Trump is optimistic about reaching a trade deal with China, which has already purchased about 1-2 million tons of soybeans from the U.S., slated for delivery between April and July. Word has it that there's also a commitment from China to keep buying. All this offset disappointing guidance from Amazon (NASDAQ:AMZN).
Positive Start To 2019
This year's first monthly close, after significant ups and downs according to investor mood swings, started 2019 off on a positive note: during January, December's 9.18% loss was trimmed to just -2.03%. Also reduced was the slide from September's record peak, down 13.97% at the end of 2018, to narrowed 7.2%.

The S&P 500 gained 0.09% on Friday, with Energy shares (+1.74%) tracking oil prices higher. WTI closed above the $55 level for the first time since November 19, after the U.S. oil rig count fell sharply. Consumer Discretionary shares were dragged down by Amazon which weighed heavily on the subindex (-1.46%).
The benchmark index gained 1.57% for the week, with all 11 sectors in the green, including Consumer Discretionary which underperformed on a weekly basis (+0.15%) as well as on the final trading day of the week. Energy shares were the strongest performers on the week (+3.11%).
The SPX jumped 7.97% on a monthly basis, its strongest January since 1987. In addition, all 11 sectors were in the green for the month, with Utilities (+3.08%) lagging and Energy (+13.15%) once again outperforming.
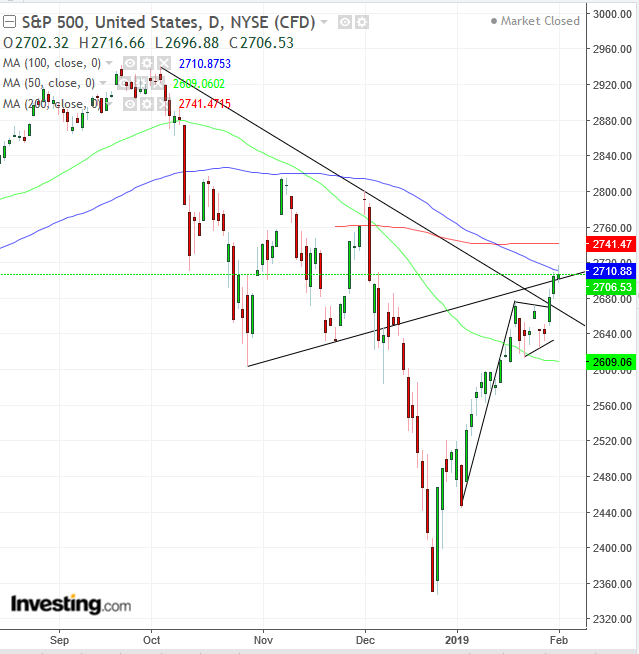
Technically, the SPX completed a pennant, suggesting the rally has more room to run, while Friday's small advance found resistance by the 100 DMA at the critical 2,700 level.
The Dow advanced 0.26% on Friday, boosted 1.32% for the week. It was the mega cap index's sixth straight weekly increase and its longest winning streak since the eight-straight weekly rise that ended during October 2017. The Dow also jumped 7.64% for the month, its best showing on that metric in three years. Technically, the 30-component index climbed above the 100 DMA and 200 DMA but formed a shooting star, closing beneath the downtrend line since its October 3 peak/record, after attempting to overcome it.
The NASDAQ Composite (-0.25%) was the only major benchmark to fall on Friday, pressured by Amazon's 5.63% slide after its Q4 2018 corporate results were released. In this new normal environment, which punishes stocks that announce strong fourth quarter results but disappoint on forecasts, the world's largest e-tailer provided lighter-than-expected forward guidance.
On a weekly basis, the tech-heavy index advanced 1.38% for its sixth consecutive weekly gain, echoing the Dow; as well, it was the first time this has occurred since the the eight-straight weeks of gains which ended during October 2017. The NASDAQ rebounded 9.74% for the month, its best performance since 2011. Technically, the index broke out of consolidation since January 18, after crossing above the downtrend line since its August 29 peak/record-high. However, after pushing above the 100 DMA intraday, it closed below it, for the second straight session.
The Russell 2000 once again outperformed peer indices, gaining 0.34%, even as trade talk optimism proliferated. The irony doesn't escape us since a trade resolution would benefit mega cap multinationals whose export-reliant growth would be boosted, while small cap domestic firms listed on the Russell would fall back to the sidelines. However, as we've pointed out repeatedly, small caps have been outperforming for the past few months, a phenomenon we can't explain.
The small-cap benchmark gained 1.22% for the week, for a sixth consecutive week. The Russell jumped 10.82 percent for the month, its best performance since 2016. Its technical picture mirrors the NASDAQ. It broke free of consolidation since January 18 after scaling above its downtrend line since its September record high/peak. Unlike the other indices, it didn't develop a small candle with long shadows, but it still has to climb above its 100 and 200 DMAs to complete a reversal.

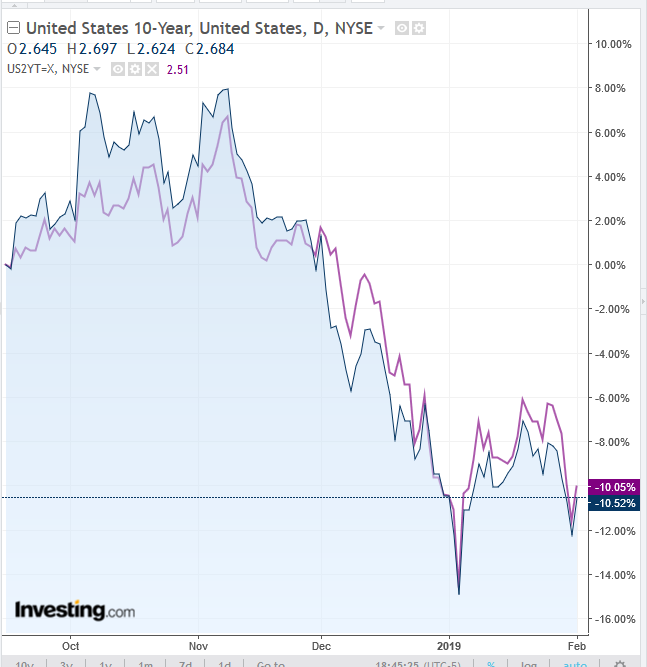
Treasurys surged on U.S. jobs growth, pushing yields on shorter-dated notes, including the 2-year, higher on Friday morning. This further flattened the yield curve after yields had already plunged just days earlier subsequent to the Fed cautioning about pausing additional interest rate hikes this year and shrinking the balance sheet.
Later in the day, Treasurys sold off following solid U.S. manufacturing data. The 10-year Treasury yield logged the most massive weekly drop in a month, even after the post jobs report spike.

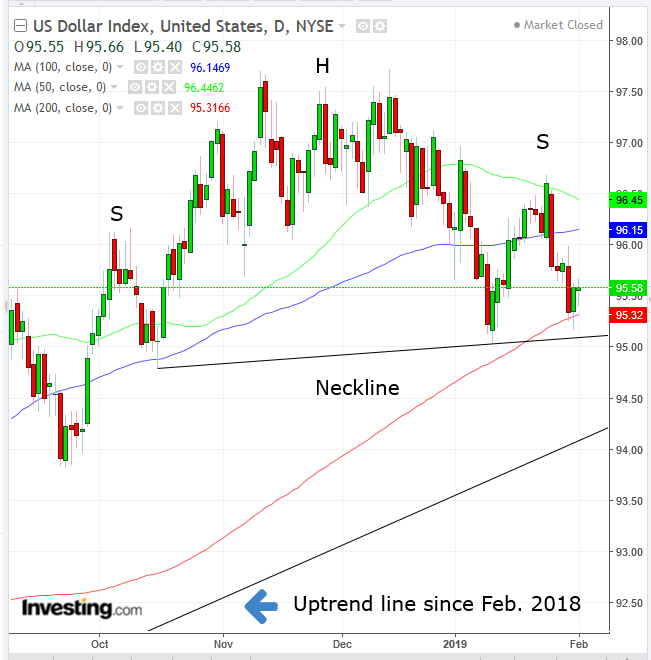
The dollar tumbled after the Fed's press conference on Wednesday, but by Thursday the global reserve currency found support by both the potential neckline of an H&S top and the 200 DMA, whose significance is attested to by the rising uptrend line since February of last year.

Baker Hughes reported a sharp drop in the number of active oil and gas rigs in the United States this past week. The total number fell by 14 rigs, according to the weekly report, with the number of active oil rigs falling by 15 to reach 847 and the number of gas rigs increasing by 1 to reach 198. The full rig count is now up by 99 from this time last year; 82 of these are oil rigs.
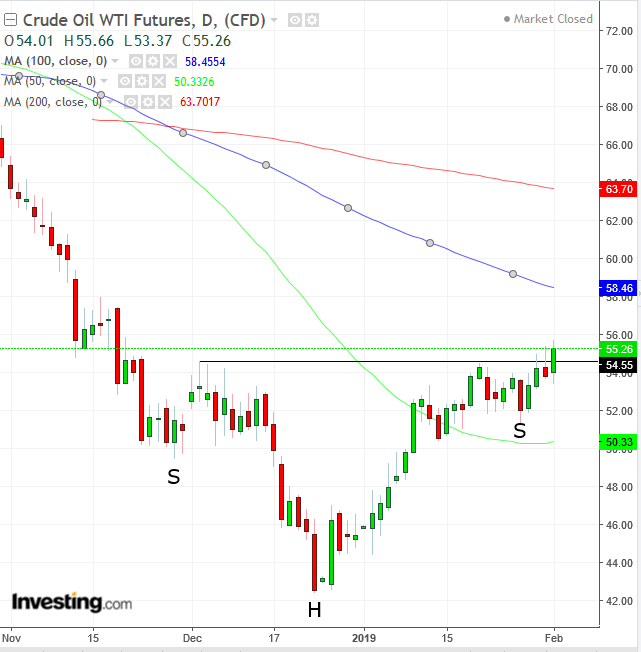
Technically, Friday's 2.73% jump for WTI crossed above the neckline of an H&S bottom since late November.
Best January For SPX Since 1987
This past month was the best January performance for the S&P 500 since 1987. Everything finally seemed to fall into place for investors: stronger-than-expected earnings, signs of progress in U.S.-Sino trade talks, a robust labor market with no discernible impact on job growth after a 35-day partial government shutdown, which did, however, push the unemployment rate to a seven-month high of 4%.
Still, there was a slight increase in wages, which could support consumer spending without driving a spike in inflation, and finally, an apparently dovish Fed. While we have been saying all along that the single most significant impact on markets is the pace of interest rates—and we think last week's market activity proved us right—with equities gearing up to return to medium-term uptrends, we would nonetheless advise caution.
Not only are we not out of the woods yet regarding trade, we believe the market jumped the gun on the Fed, seeing its flexibility and newfound patience as a shift in policy, which isn't the case. Fed Chair Jerome Powell said time and again in his press conference that the Fed is entirely data dependent. Since there's still much data missing due to the shutdown, the Fed can't make any meaningful assessment at this point.
In other words, no evaluation was made. Rather, Powell played the economic cheerleader by reiterating what he'd already said in the previous press conference; the U.S. economy is doing well and the outlook is that it will continue to grow. If Powell says repeatedly that the Fed cannot fully assess the situation at this time, how is it that the markets interpret it as a policy shift?
The Week Ahead
All times listed are EST
Monday
4:30: U.K. – Construction PMI (January): expected to fall to 52.6 from 52.8.
22:30: Australia – RBA Rate Decision: no change in policy expected.
Tuesday
4:30: U.K. – Services PMI (January): predicted to fall to 51.1 from 51.2.
10:00: U.S. – ISM Non-Manufacturing PMI (January): forecast to fall to 57.0 from 57.6.
Wednesday
8:30: U.S. – Trade Balance (November), GDP (Q4 preliminary): trade deficit to narrow to $54 billion from $55.5 billion, and GDP expected to grow by 2.6% QoQ, from 3.4%.
8:30: U.S. – Retail Sales, Housing Starts and Building Permits, Durable Goods Orders (December): retail sales to rise 0.1% month-on-month (MoM), and durable goods orders to remain flat at 0.8% MoM.
10:00: Canada – Ivey PMI (January): expected to rise to 60.2 from previous reading of 59.7.
10:30: U.S. – EIA Crude Inventories (w/e 1 February): stockpiles rose by 919,000 last week.
Thursday
7:00: U.K. – BoE Rate Decision: no change in policy expected, though with no progress on Brexit it will be interesting to watch the MPC’s views on the U.K. economy.
8:30: U.S. – Initial Jobless Claims (w/e 2 February): probably fell to 220K from 253K.
Friday
2:00: Germany – Trade Balance (December): surplus to narrow to €18.1billion from €19.0 billion.
8:30: Canada – Employment Data (January): jobs forecast to have fallen to 6,000 from 9,300 jobs created last month. Unemployment rate expected to rise to 5.7% from 5.6%.
