
Weak China growth suggests market’s AUD forecast too optimistic:
Today’s round of service sector Purchasing Managers Indices (PMIs) for December got off to a disappointing start as the HSBC/Markit Services PMI for China fell to 50.9 from 52.5 in November. This comes on the heels of a drop in China’s manufacturing sector PMI in December and confirms the slowdown in the Chinese economy. As the government there comes to grips with the twin problems of overcapacity in manufacturing and excessive local government debt, China is likely to be the next country to go through the deleveraging process, which will naturally result in slower growth. That would be bad news for countries that sell commodities to China, including Australia, New Zealand to a lesser extent, and many emerging-market countries. This is one reason why I think the market’s bullish forecast for AUD/USD this year is excessive. AUD is forecast to be the second-best performing currency among the G10 on a total return basis (end-year consensus forecast, according to Bloomberg: 0.87, but with interest return of 2.9%, that’s enough to result in a positive total return against the dollar). I would expect to see AUD/USD move lower than that as the Chinese economy slows, leading to worse performance than the market consensus.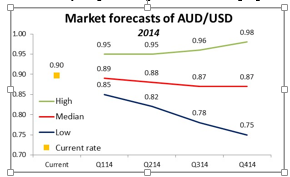 AUD/USD Forecast Chart" title="AUD/USD Forecast Chart" width="291" height="177">
The USD/JPY came off from its highs during the day as the Tokyo stock market fell (0.8% on the TOPIX but 2.4% on the Nikkei), but it managed to remain slightly above Friday’s opening levels (104.29 vs 104.09). That demonstrates to me the resilience of the dollar in 2014. The US currency is probably being supported by expectations for today’s US data: the non-manufacturing ISM index is expected to rise on 54.6 from 53.9, in contrast to the expected fall in the Eurozone service-sector PMI, and US factory orders are seen rising 1.7% mom in November after falling 0.9% in October. That would confirm the picture of an expanding US economy contrasting with a Eurozone economy that is just barely stabilizing, which is positive for the dollar. 
The European day starts with Norway’s manufacturing PMI for December, which is expected to remain unchanged at 54.5. Then come the service-sector PMIs. Italy’s is expected to have risen to 48.8 in December from 47.2 in November, while UK’s figure is estimated to be slightly up to 60.3 from 60.0 in the previous month. We also have the final service-sector PMIs for December from France, Germany and Eurozone as a whole, which as usual are forecast to be unchanged from the preliminary figures.
Other indicators coming out Monday include Germany’s preliminary CPI for December, which is estimated to have accelerated to +0.7% mom from 0.2% mom in November, although that would imply a slowdown in inflation on a yoy basis. A slowdown in German inflation would be EUR-negative, although it remains to be seen whether the market focuses on the month-on-month or year-on-year figure. Last month the regional CPIs from Germany announced before the national figure were market-affecting so this indicator is likely to be closely watched.
As for the rest of the week, on Thursday Bank of England and ECB are holding their policy meetings. Once again, no change is expected from either Bank, so the attention will fall on the press conference held by ECB President Mario Draghi. If he again plays down the likelihood of any further easing near-term, as he has in recent speeches, that could cause a bounce in EUR/USD. But the next day brings the US nonfarm payrolls for December. They are expected to be up 193k, which would be enough to support continued tapering off of the Fed’s bond purchases and would therefore be USD-supportive, in my view.
The Market
EUR/USD 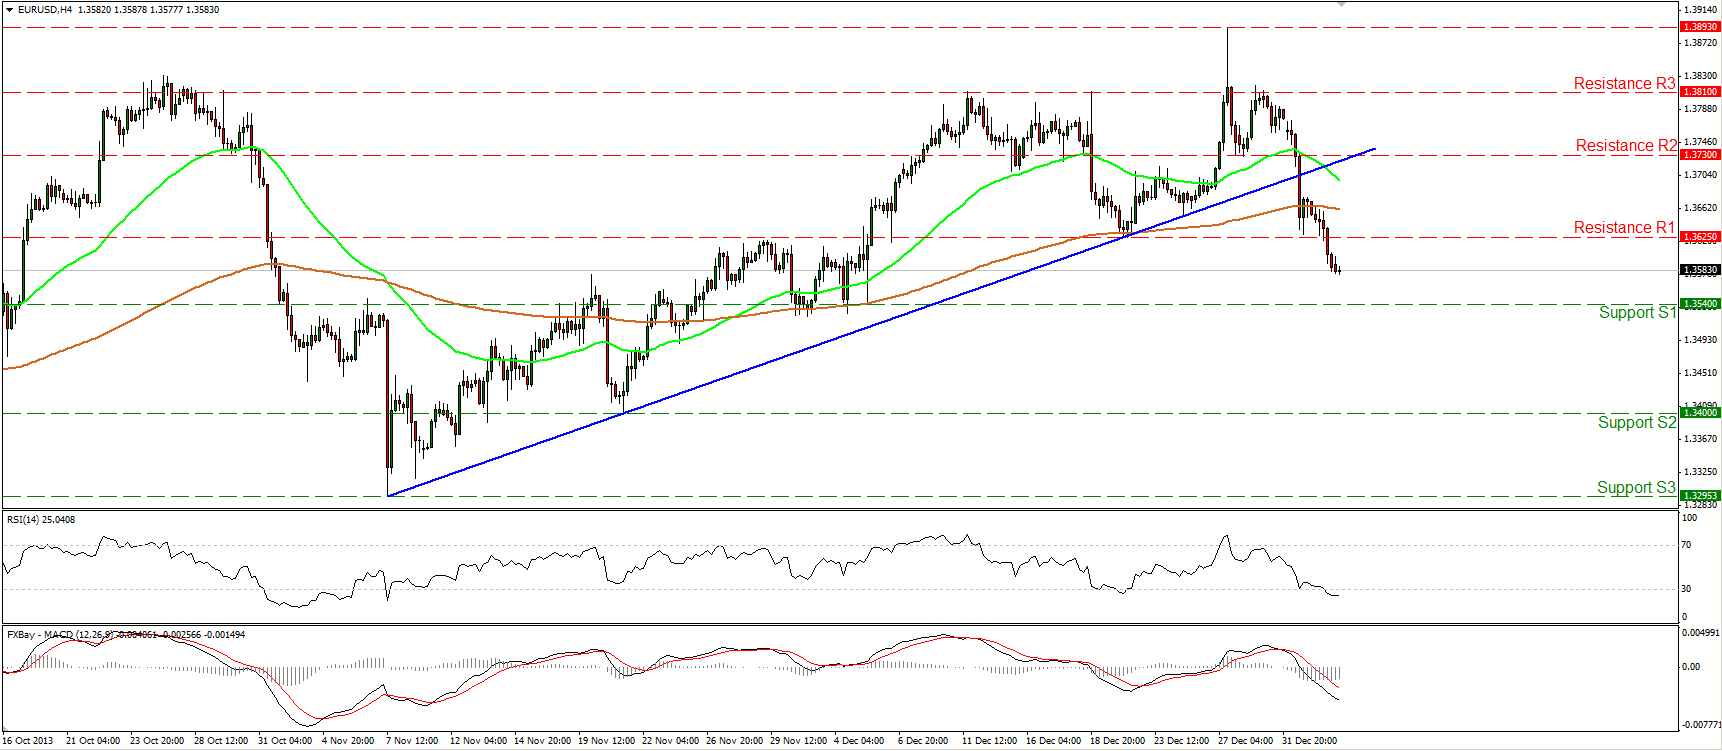 EUR/USD 4-Hour Chart" title="EUR/USD 4-Hour Chart" width="291" height="177">
The EUR/USD continued falling on Friday and managed to overcome the previous low of 1.3625. During the early European morning, the rate is trading between the support level of 1.3540 (S1) and the resistance of 1.3625 (R1). A clear dip below 1.3540 (S1) may trigger extensions towards the next support at 1.3400 (S2). Nonetheless, the RSI indicates oversold conditions, thus an upwards corrective wave, perhaps testing the validity of the 1.3625 (R1) level as resistance, cannot be ruled out.
• Support: 1.3540 (S1), 1.3400 (S2), 1.3295 (S3).
• Resistance: 1.3625 (R1), 1.3730 (R2), 1.3810 (R3).
EUR/JPY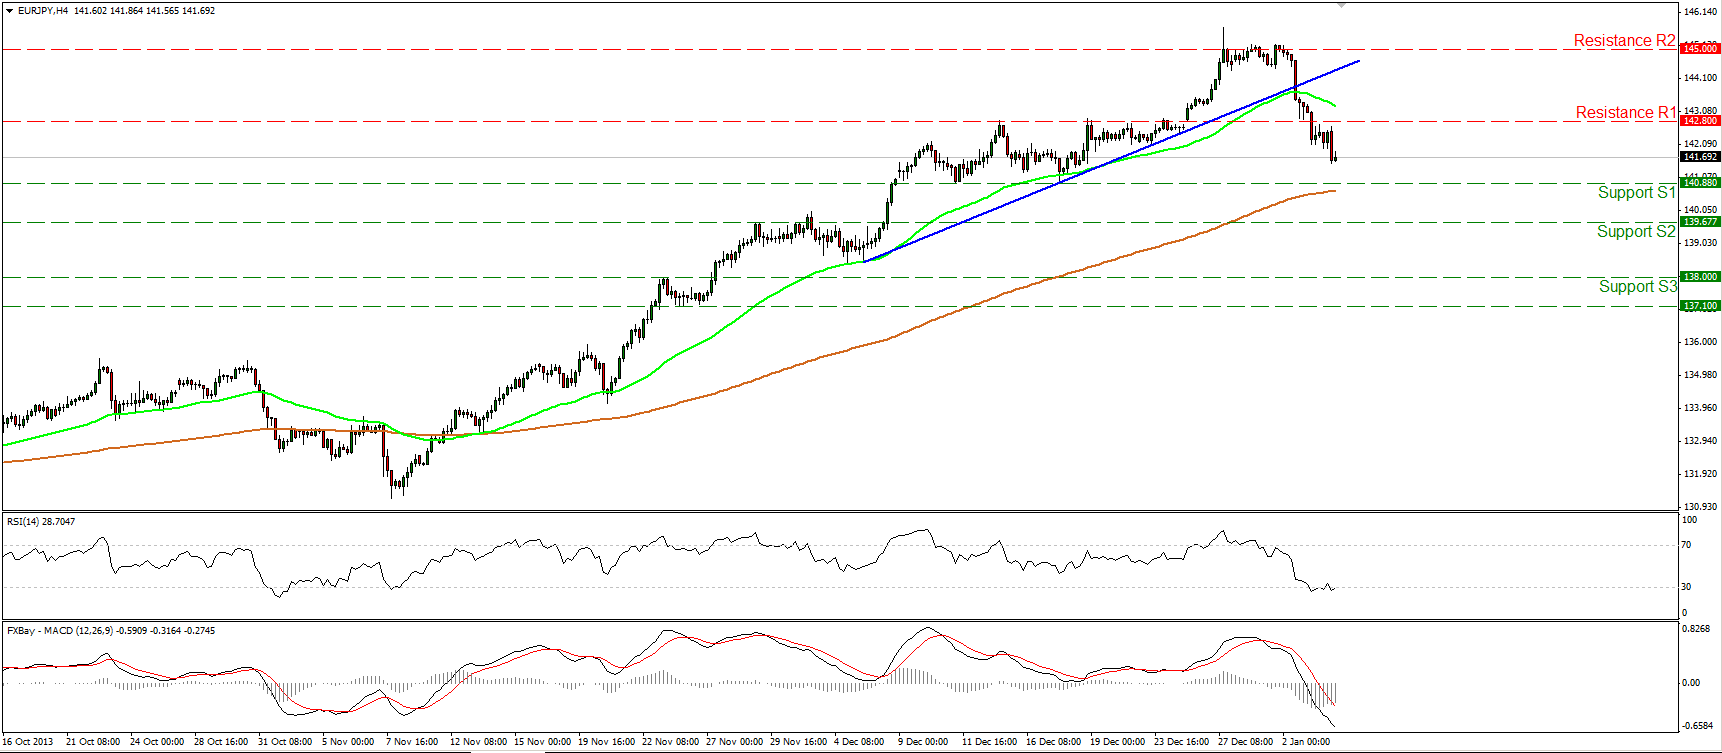 EUR/JPY 4-Hour Chart" title="EUR/JPY 4-Hour Chart" width="291" height="177">
The EUR/JPY moved slightly lower, remaining between the support of 140.88 (S1) and the resistance of 142.80 (R1). The 200-period moving average lies near the 140.88 (S1) support, thus a downward break of that area may have larger bearish implications. The MACD lies below both its trigger and zero lines, while the RSI seems ready to cross above its 30 level, thus I would expect further consolidation or an upward corrective wave, before the bears prevail again.
• Support: 140.88 (S1), 139.67 (S2), 138.00 (S3).
• Resistance: 142.80 (R1), 145.00 (R2), 147.00 (R3).
GBP/USD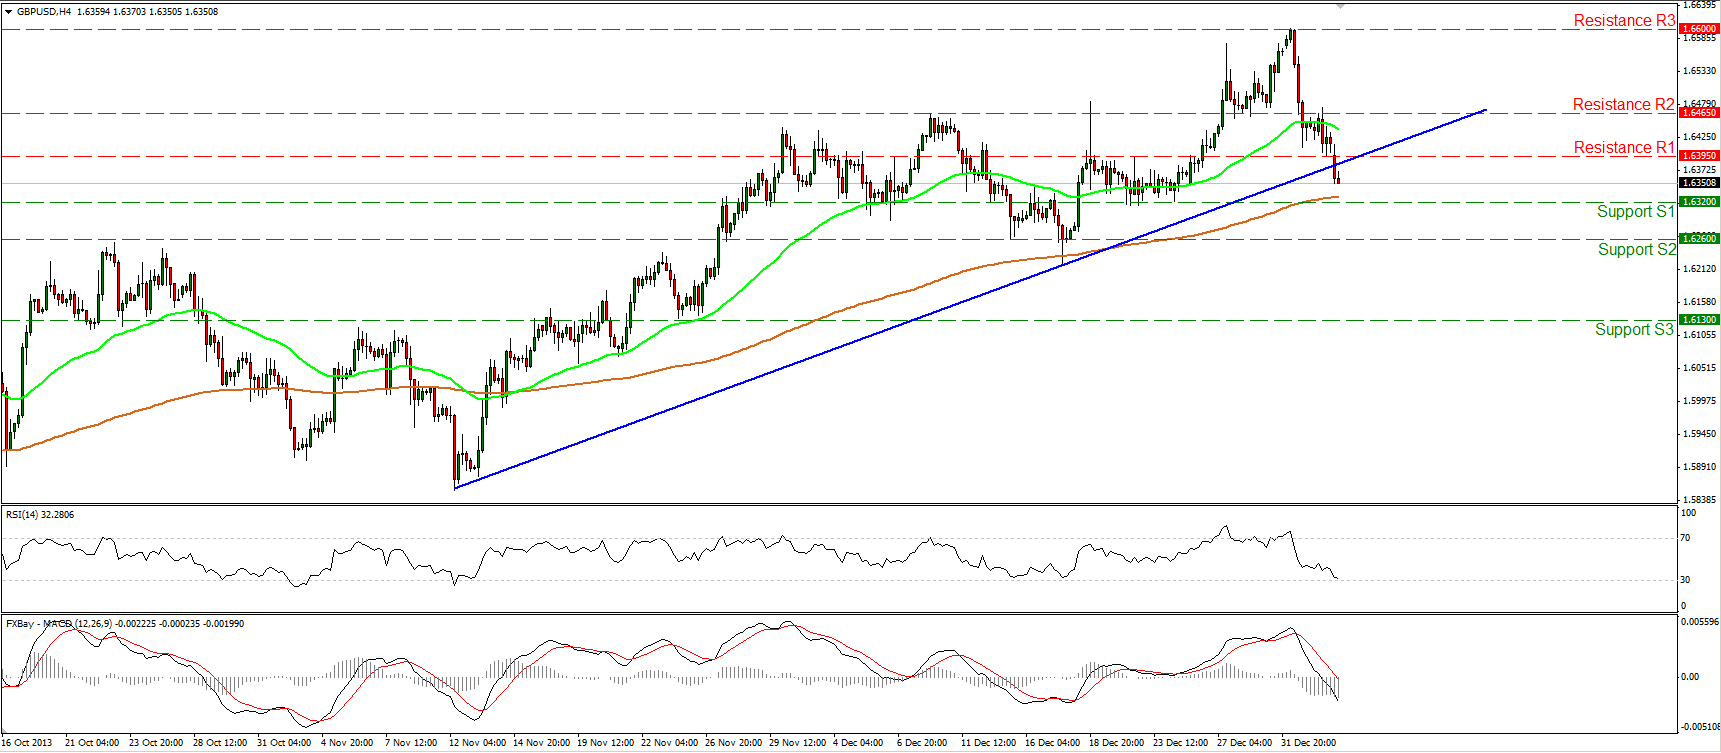 GBP/USD 4 Hour Chart" title="GBP/USD 4 Hour Chart" width="291" height="177">
The GBP/USD moved lower, breaking below the barrier of 1.6395 and below the short-term blue uptrend line. The pair confirmed my worries stemming from the bearish engulfing candlestick pattern on the daily chart and the negative divergence between the daily MACD and the price action. The rate is now trading above the 1.6320 (S1) support level, where a downward penetration would confirm a lower low and may turn the bias to the downside.
• Support: 1.6320 (S1), 1.6260 (S2), 1.6130 (S3).
• Resistance: 1.6395 (R1), 1.6465(R2), 1.6600 (R3).
Gold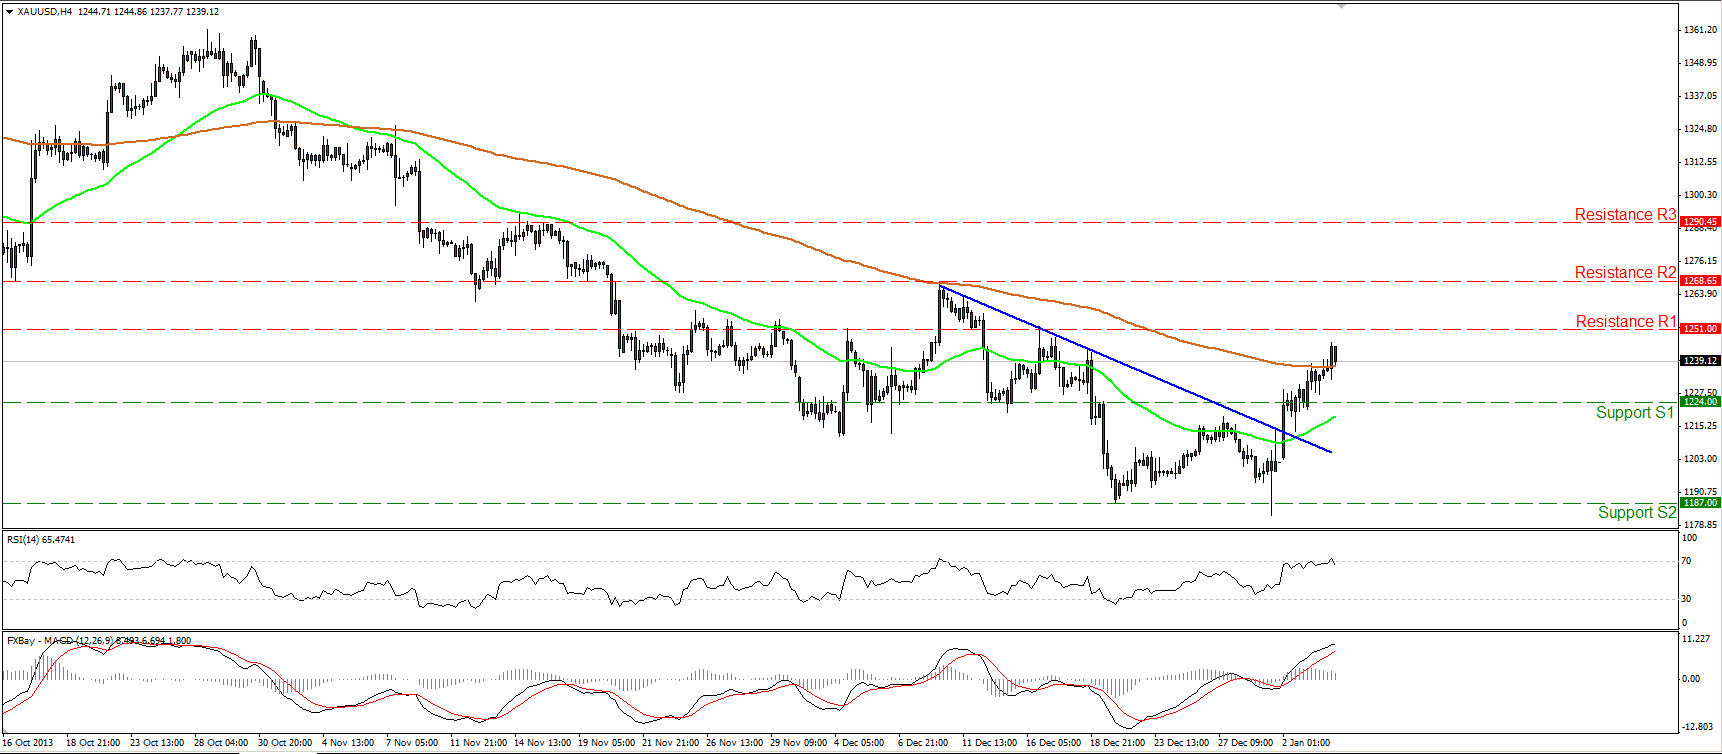 XAU/USD 4 Hour Chart" title="XAU/USD 4 Hour Chart" width="291" height="177">
Gold continued moving higher on Friday. The metal is trading above the 200-period moving average for the first time since the last days of October. A break above the 1251 (R1) hurdle may trigger extensions towards the next resistance at 1268 (R2). The MACD remains above both its signal and zero lines, but the RSI is still finding resistance near its 70 level. On the daily and weekly charts the longer-term downtrend remains in effect.
• Support: 1224 (S1), 1187 (S2), 1155 (S3).
• Resistance: 1251 (R1), 1268 (R2), 1290 (R3).
Oil
WTI continued falling on Friday, breaking below the 95.35 hurdle. The decline was halted by the key support barrier of 94.00 (S1). A break below that level may trigger extensions towards the next key support at 92.00 (S2). The 50-period moving is getting closer to the 200-period moving average, thus a bearish cross in the near future may increase the possibility of establishing a new short- term downtrend.
• Support: 94.00 (S1), 92.00 (S2), 90.15 (S3).
• Resistance: 95.35 (R1), 97.25 (R2), 98.90 (R3).
BENCHMARK CURRENCY RATES - DAILY GAINERS AND LOSERS
MARKETS SUMMARY:
Disclaimer: This information is not considered as investment advice or investment recommendation but instead a marketing communication. This material has not been prepared in accordance with legal requirements designed to promote the independence of investment research, and that it is not subject to any prohibition on dealing ahead of the dissemination of investment research. IronFX may act as principal (i.e. the counterparty) when executing clients’ orders. This material is just the personal opinion of the author(s) and client’s investment objective and risks tolerance have not been considered.
IronFX is not responsible for any loss arising from any information herein contained. Past performance does not guarantee or predict any future performance. Redistribution of this material is strictly prohibited. Risk Warning: Forex and CFDs are leveraged products and involves a high level of risk. It is possible to lose all your capital. These products may not be suitable for everyone and you should ensure that you understand the risks involved. Seek independent advice if necessary. IronFx Financial Services Limited is authorised and regulated by CySEC (Licence no. 125/10). IronFX UK Limited is authorised and regulated by FCA (Registration no. 585561). IronFX (Australia) Pty Ltd is authorized and regulated by ASIC (AFSL no. 417482)
- English (UK)
- English (India)
- English (Canada)
- English (Australia)
- English (South Africa)
- English (Philippines)
- English (Nigeria)
- Deutsch
- Español (España)
- Español (México)
- Français
- Italiano
- Nederlands
- Português (Portugal)
- Polski
- Português (Brasil)
- Русский
- Türkçe
- العربية
- Ελληνικά
- Svenska
- Suomi
- עברית
- 日本語
- 한국어
- 简体中文
- 繁體中文
- Bahasa Indonesia
- Bahasa Melayu
- ไทย
- Tiếng Việt
- हिंदी
Weak China Growth Suggest Market's AUD Forecast Too Optimistic
Published 01/07/2014, 12:33 AM
Updated 12/18/2019, 06:45 AM
Weak China Growth Suggest Market's AUD Forecast Too Optimistic
3rd party Ad. Not an offer or recommendation by Investing.com. See disclosure here or
remove ads
.
Latest comments
Install Our App
Risk Disclosure: Trading in financial instruments and/or cryptocurrencies involves high risks including the risk of losing some, or all, of your investment amount, and may not be suitable for all investors. Prices of cryptocurrencies are extremely volatile and may be affected by external factors such as financial, regulatory or political events. Trading on margin increases the financial risks.
Before deciding to trade in financial instrument or cryptocurrencies you should be fully informed of the risks and costs associated with trading the financial markets, carefully consider your investment objectives, level of experience, and risk appetite, and seek professional advice where needed.
Fusion Media would like to remind you that the data contained in this website is not necessarily real-time nor accurate. The data and prices on the website are not necessarily provided by any market or exchange, but may be provided by market makers, and so prices may not be accurate and may differ from the actual price at any given market, meaning prices are indicative and not appropriate for trading purposes. Fusion Media and any provider of the data contained in this website will not accept liability for any loss or damage as a result of your trading, or your reliance on the information contained within this website.
It is prohibited to use, store, reproduce, display, modify, transmit or distribute the data contained in this website without the explicit prior written permission of Fusion Media and/or the data provider. All intellectual property rights are reserved by the providers and/or the exchange providing the data contained in this website.
Fusion Media may be compensated by the advertisers that appear on the website, based on your interaction with the advertisements or advertisers.
© 2007-2024 - Fusion Media Limited. All Rights Reserved.