While I color myself concerned about the selling taking place in stocks, I do not think we have seen the top, not yet at least.
It never ceases to amaze me how fast the sentiment changes in the market. We go from cheering on new highs to people already looking for an 1987-type crash. Don’t get me wrong, it makes my uneasy when I read an article in GQ where the author, while writing about stripes, throws in lines like: “Button up one of the bolder striped shirts out there and you’ll be ready to do more than push stocks” or “built for mergers, acquisitions.” You rarely want to see references to Wall St in non-financial publications and while this one was subtle it still stood out. There are many pieces of data that show retail investors have come back stocks and even men’s magazines are taking their cue.
There’s been a lot of discussion about whether we have seen the peak in the stock market and if we are about to see a repeat of 2007. Business Insider has been running stories about the anonymous twitter user who may have called the top even though we are down just 7%, which is less than the corrections we saw in 2010, 2011, and 2012.
While I can understand the similarities between the prior peak and the current price action, I do not think we’ve seen enough deterioration in breadth and momentum in order to be confident that the S&P 500 will not make a new high in the coming weeks.
In late-September I showed the divergences that were taking place in the Advance-Decline Line (breadth) and the Relative Strength Index (momentum) and how they were acting as negative symptoms that could send prices lower. While they were in fact diverging, they had not separated from the equity market to the same degree as prior market tops.
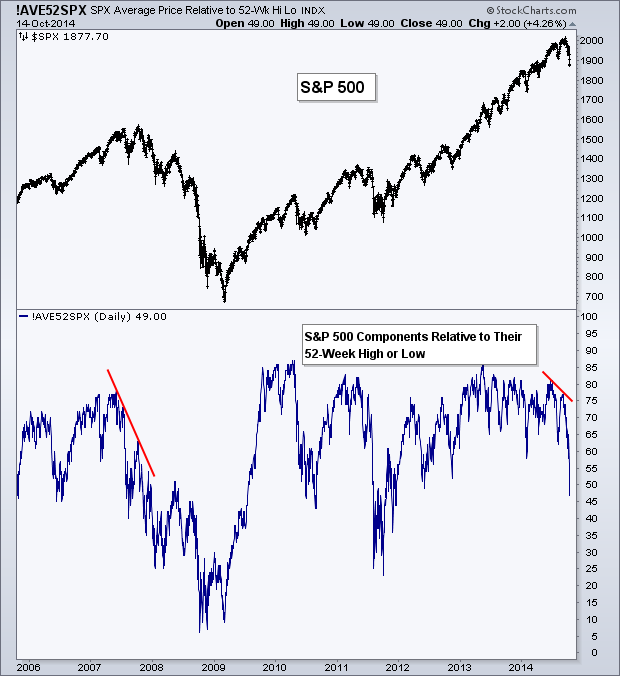
A different example is the following chart showing the S&P 500 components relative to their respective 52-week high and low. The more stocks that are closer to their own 52-week low, the farther down the line falls. You can see that at the 2007 high, the divergence was much more pronounced than the small separation we have today. Before the small decline in July and August of ’07 we saw this indicator diverge just like it’s during right now. I’ll show why this may be important later on.

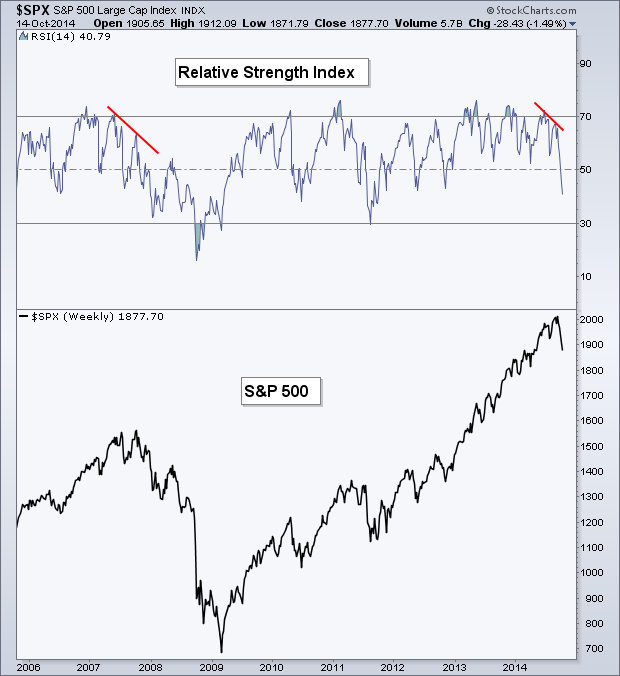
How about momentum? We do have a bearish divergence that developed at the most recent high but again, it was not at the same degree as we saw in 2007. Momentum (like breadth) was much weaker going into the market top than it is today. Like the chart above, a smaller divergence was created that led to the July/August drop prior to the ’07 peak.

If we must (do we have to?) compare this market environment to something then it seems more like July/August of 2007 than October 2007. The drop that lead to the market top in ’07 lasted roughly 9% and set up both breadth and momentum to create much larger divergences as fewer stocks participating in the advance. The July high as I showed in the two charts above had bearish divergences present, but they were less severe, like they are now, than what eventually was created into the actual peak.
So while the sectors that have been leading this year (Utilities, Consumer Staples, and Health Care), the breakdown in High Yield bonds, and the start of breadth and momentum weakening are very reminiscent of the prior market high, I don’t believe we are there quite yet. It sure seems like there are a lot of traders preparing for a market crash and we rarely see the market give the people what they want. Another advance to a new high before stocks sell-off again may just be what catches the most traders off guard.
This isn’t the market environment that makes me put on my bull hat but at the same time I think patience is key and we need to see how price action shapes out over the next two weeks. There are plenty of signs that stocks may have over-extended to the downside, it’s just a matter of if Mr. Market decides to care. I could be wrong and if that’s the case then I’ll happily switch my bias to reflect the latest price action. As always, I continue to respect what price is telling us, but if history is our guide then we likely have not seen the market peak just yet.
Disclaimer: Do not construe anything written in this post or this blog in its entirety as a recommendation, research, or an offer to buy or sell any securities. Everything in this post is meant for educational and entertainment purposes only. I or my affiliates may hold positions in securities mentioned in the blog. Please see my Disclosure page for full disclaimer.
