The US dollar has posted steady gains for three weeks now. Ahead of an important week that will see US durable goods orders, revised Q1 GDP estimates and Fed voting member speeches including Fed Chair Janet Yellen's speech this Friday, the dollar looks vulnerable at the current levels.
EUR/USD Daily Analysis

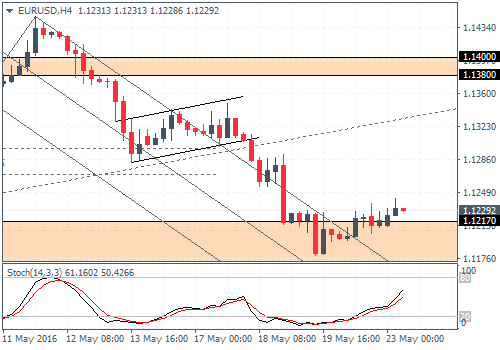
EUR/USD (1.120): EUR/USD has reached its bearish flat target last Thursday and has since then moved into trading in range. Price action sits in the support zone of 1.1217 - 1.1143, and we suspect that the downside risks are limited from here. A pullback towards 1.140 - 1.138 is likely to emerge over the week.
EUR/USD remains biased to the downside, so the short-term expected pullback to test the resistance near 1.140 - 1.138 is likely to offer a good opportunity for sellers of the single currency.
The daily candlesticks on Thursday/Friday have been small in their ranges, and with 1.120 main support, it validates the move to 1.13 - 1.140.
In the event that EUR/USD slips below 1.120, depending on the momentum, the next lower support will be at 1.110.
USD/JPY Daily Analysis

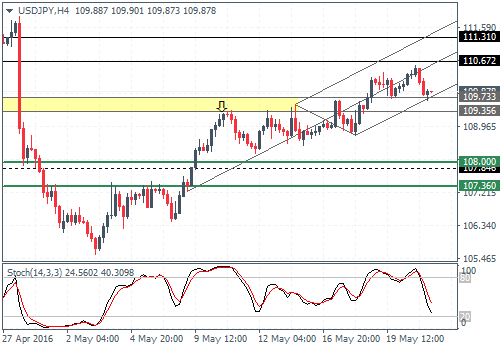
USD/JPY (109.80): USD/JPY has failed to clear the 50 period daily EMA for the past three sessions. The 50-day EMA sits a few pips below the 111.0 round number resistance, which could cap potential rallies.
The support near 107.95 - 107.50 remains a key level of interest, as prices have not tested this broken support, leaving USD/JPY vulnerable to the downside.
USD/JPY has also been rising steadily for the past three weeks, with the previous two weekly sessions clearing the 107.95 - 107.50 support. However as mentioned earlier, with this support level not being tested just yet, the downside risks are considerable.
GBP/USD Daily Analysis

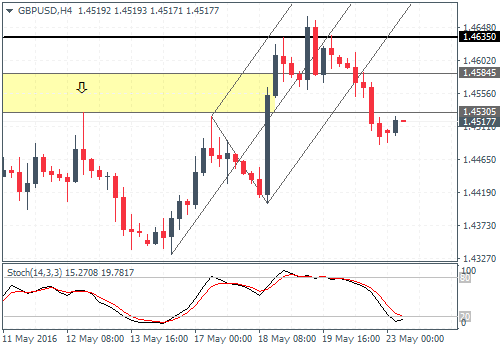
GBP/USD (1.451): GBP/USD closed Friday's session on a strong bearish note, with the previous day's candlestick closing with a doji right near the 1.4635 - 1.4743 resistance level.
While the inverse head and shoulders pattern is obvious on the daily chart, the fact that prices have made a lower high above the neckline support/resistance at 1.44250 makes the bullish pattern questionable.
Unless the support at 1.4425 holds, GBP/USD remains at risk of a sharp decline towards 1.42.
Gold Daily Analysis

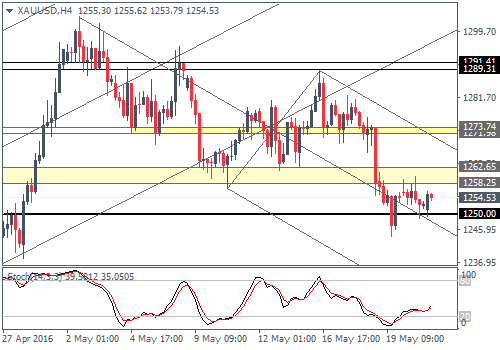
XAU/USD (1254): Gold prices have fallen for the past three daily sessions, but despite intraday dips below 1250, gold has managed to close above 1250 for the past two daily sessions.
Resistance is seen at 1264 - 1270, which is likely to be tested as the downside remains limited for now. Support at 1240 - 1245 will be key to watch for any potential reversal at these lows.
To the upside, only a strong price action above 1270 will determine if gold prices can push higher, so for the moment, gold remains stuck below 1270.
