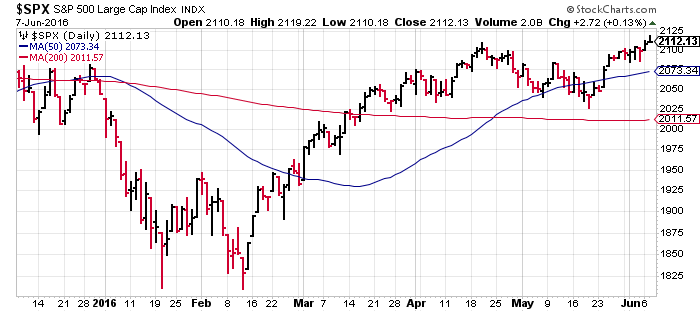
The S&P 500 inched higher again yesterday (June 7), closing at at 2112.13–the highest level since last July. The all-time high— 2130.82 on May 21, 2015—is now within shouting distance.
The latest upside momentum gives the bulls fresh confidence for arguing that the bear market is over—or perhaps there was never a bear-market in the first place. In any case, the stock market has mounted an impressive rally since the February bottom and for the moment the upside bias remains intact.
The next hurdle, of course, is the all-time high of 2112.13. If the S&P can close above that level, we’ll have something approximating a formal revival (continuation?) of the bull market that began seven years ago, as the Great Recession was winding down in mid-2009.
At that point, the buy-and-holders will have a powerful I-told-you-so moment. The question is whether the market can rally further from here?

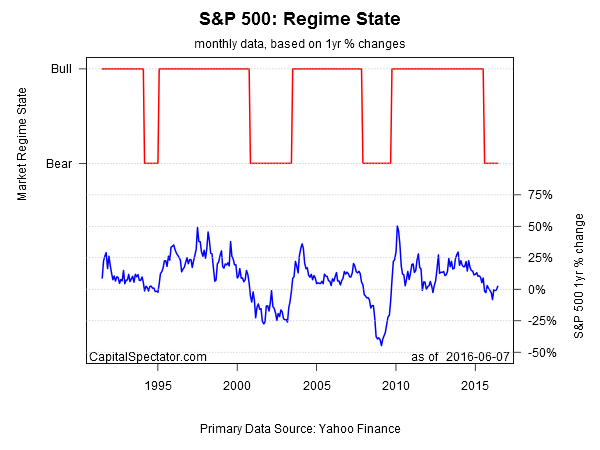
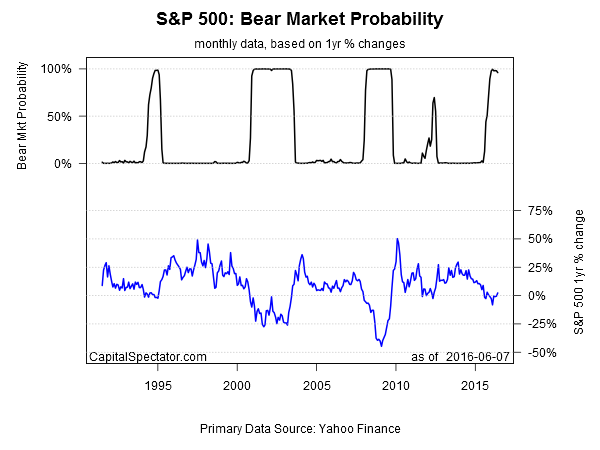
While we wait for the answer, note that the bear-market signal that’s been in force since last August (based on a Hidden Markov model (HMM)—see here and here for background) endures. A regime shift that moves the needle back into a bull-market state may be near, however.
If the market continues to rally, you can count on it. But for the moment, based on numbers through yesterday (June 7), the HMM data still point to a bear market, which implies that the recent rally is one of the infamous bear traps—a rally within a bear market. Yes, the signal could be wrong and so all the standard caveats apply. Regardless, here’s how the charts stack up at the moment:


Note that the graphs above reflect monthly data, based on rolling one-year S&P changes (with the current month as of the June 7 price), although a similar profile emerges with daily data. In both cases, the bear’s still growling.
It’s unclear if that reading is headed into the failed-signal file. Or is Mr. Market baiting the bulls with a bear-market rally? Questions, questions.
If you’re time horizon is long enough, you can safely avoid such complications and focus on other matters. Otherwise, the case for lightening up on equity allocations, if only modestly, is still a reasonable idea.
Sure, taking that advice comes with risk, albeit in the form of less equity related performance if the market continues to rally. But there’s risk on the flip side—holding fast to an equity allocation at or near the upper level of the allowable weight as the market slide resumes.
“I’d really boil it down that a lot of fears and risks that dominated the sentiment earlier in the year appear to have stabilized,” Joseph Tanious, an investment strategist at Bessemer Trust tells Bloomberg. “The fact that we’re back to the levels where we were previously is definitely a sign that a lot of stress in the market has faded.”
Some strategists will be watching to see if the market can reach a new 52-week high. In that case, the odds for a summer rally will strengthen, or so we’re told. “The data show that when the S&P 500 closes at a new 252-session high [52-week high] after not closing at a new 252-day high for 300 or more calendar days—a long pause, the implications are very bullish and new highs should not be feared,” advises Stephen Suttmeier, chief equity technical strategist at Bank of America Merrill Lynch, in a Tuesday report via MarketWatch.
The current 52-week high, MarketWatch notes, is 2,128.28 (as of July 20, 2015). If the recent rally rolls on, we could see the S&P reach that level by the end of the week. Unfortunately, Mr. Market remains mum, as always, about his next move.
