Earlier this month I wrote about an econometric tool—Hidden Markov model (HMM)—for identifying the start of bear markets, as early as possible and with a relatively high degree of confidence. The record looks encouraging for the past 50 years with the US stock market (S&P 500), although some readers wondered if this upbeat in-sample analysis would hold up in an out-of-sample context. That’s always a relevant question when forecasting (or nowcasting or even backcasting). Many models look wonderful with historical numbers only to stumble when applied in real time going forward. Is that fate for the HMM process I outlined a few weeks ago? Not necessarily, as a bit of testing suggests.
I’ve analyzed the HMM application for the S&P 500 by using only the data available up to various points in history. The results of this experiment suggest that HMM will hold up on an out-of-sample basis.
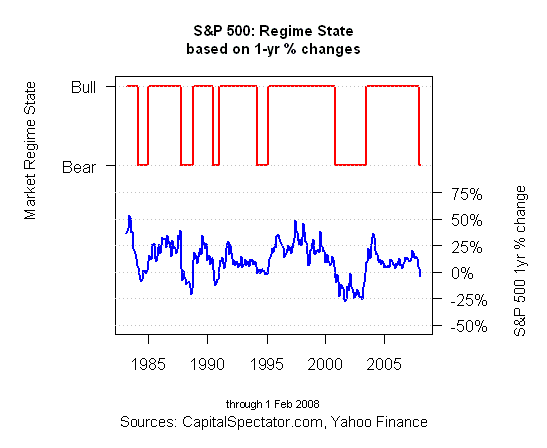
For instance, consider how the model would have worked at the start of the Great Recession, which began in January 2008, according to NBER. The stock market was beginning to crack around this time, although that’s only obvious in hindsight. In January 2008, in fact, there was still widespread optimism that the economy and the stock market, although both were wobbling at the time, would resume their upward trajectories. The crowd would eventually learn otherwise, but this would take months to sort out in terms of convincing the average investor. By contrast, the real-time signals of HMM in January and February of 2008 were reflecting a regime shift, i.e., the start of a bear market. (Something similar was unfolding for macro via the recession warning in the vintage data for the Economic Trend Index, but that’s another subject.)
At the start of February 2008, crunching the available stock market data up to that point with a HMM indicated a regime shift—the bull market regime had switched to a bear market regime. (Note: I’m using the depmixS4 package in R for the analysis.)

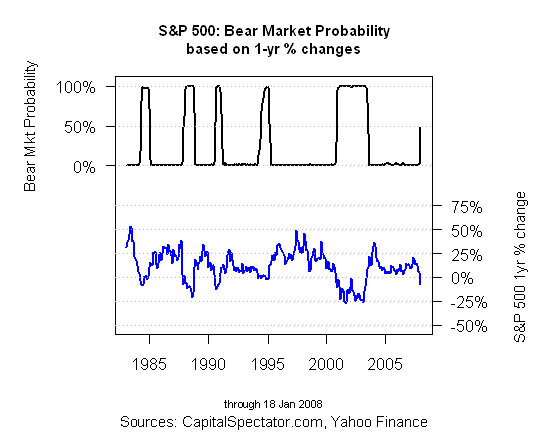
HMM-associated probabilities began dropping clues of an impending regime shift a few weeks earlier. Although the probability signals in January didn’t quite rise to the level of an outright regime shift, the consistently rising odds of a new bear market looked worrisome as the first month of 2008 unfolded. For instance, here’s how the HMM probability profile stacked up when running the available numbers through January 18, 2008:

Clearly, the risk of a new bear market was on the march, reaching 50% in mid-January 2008. By the end of that month, HMM analysis would all but confirm that the tipping point had been reached.
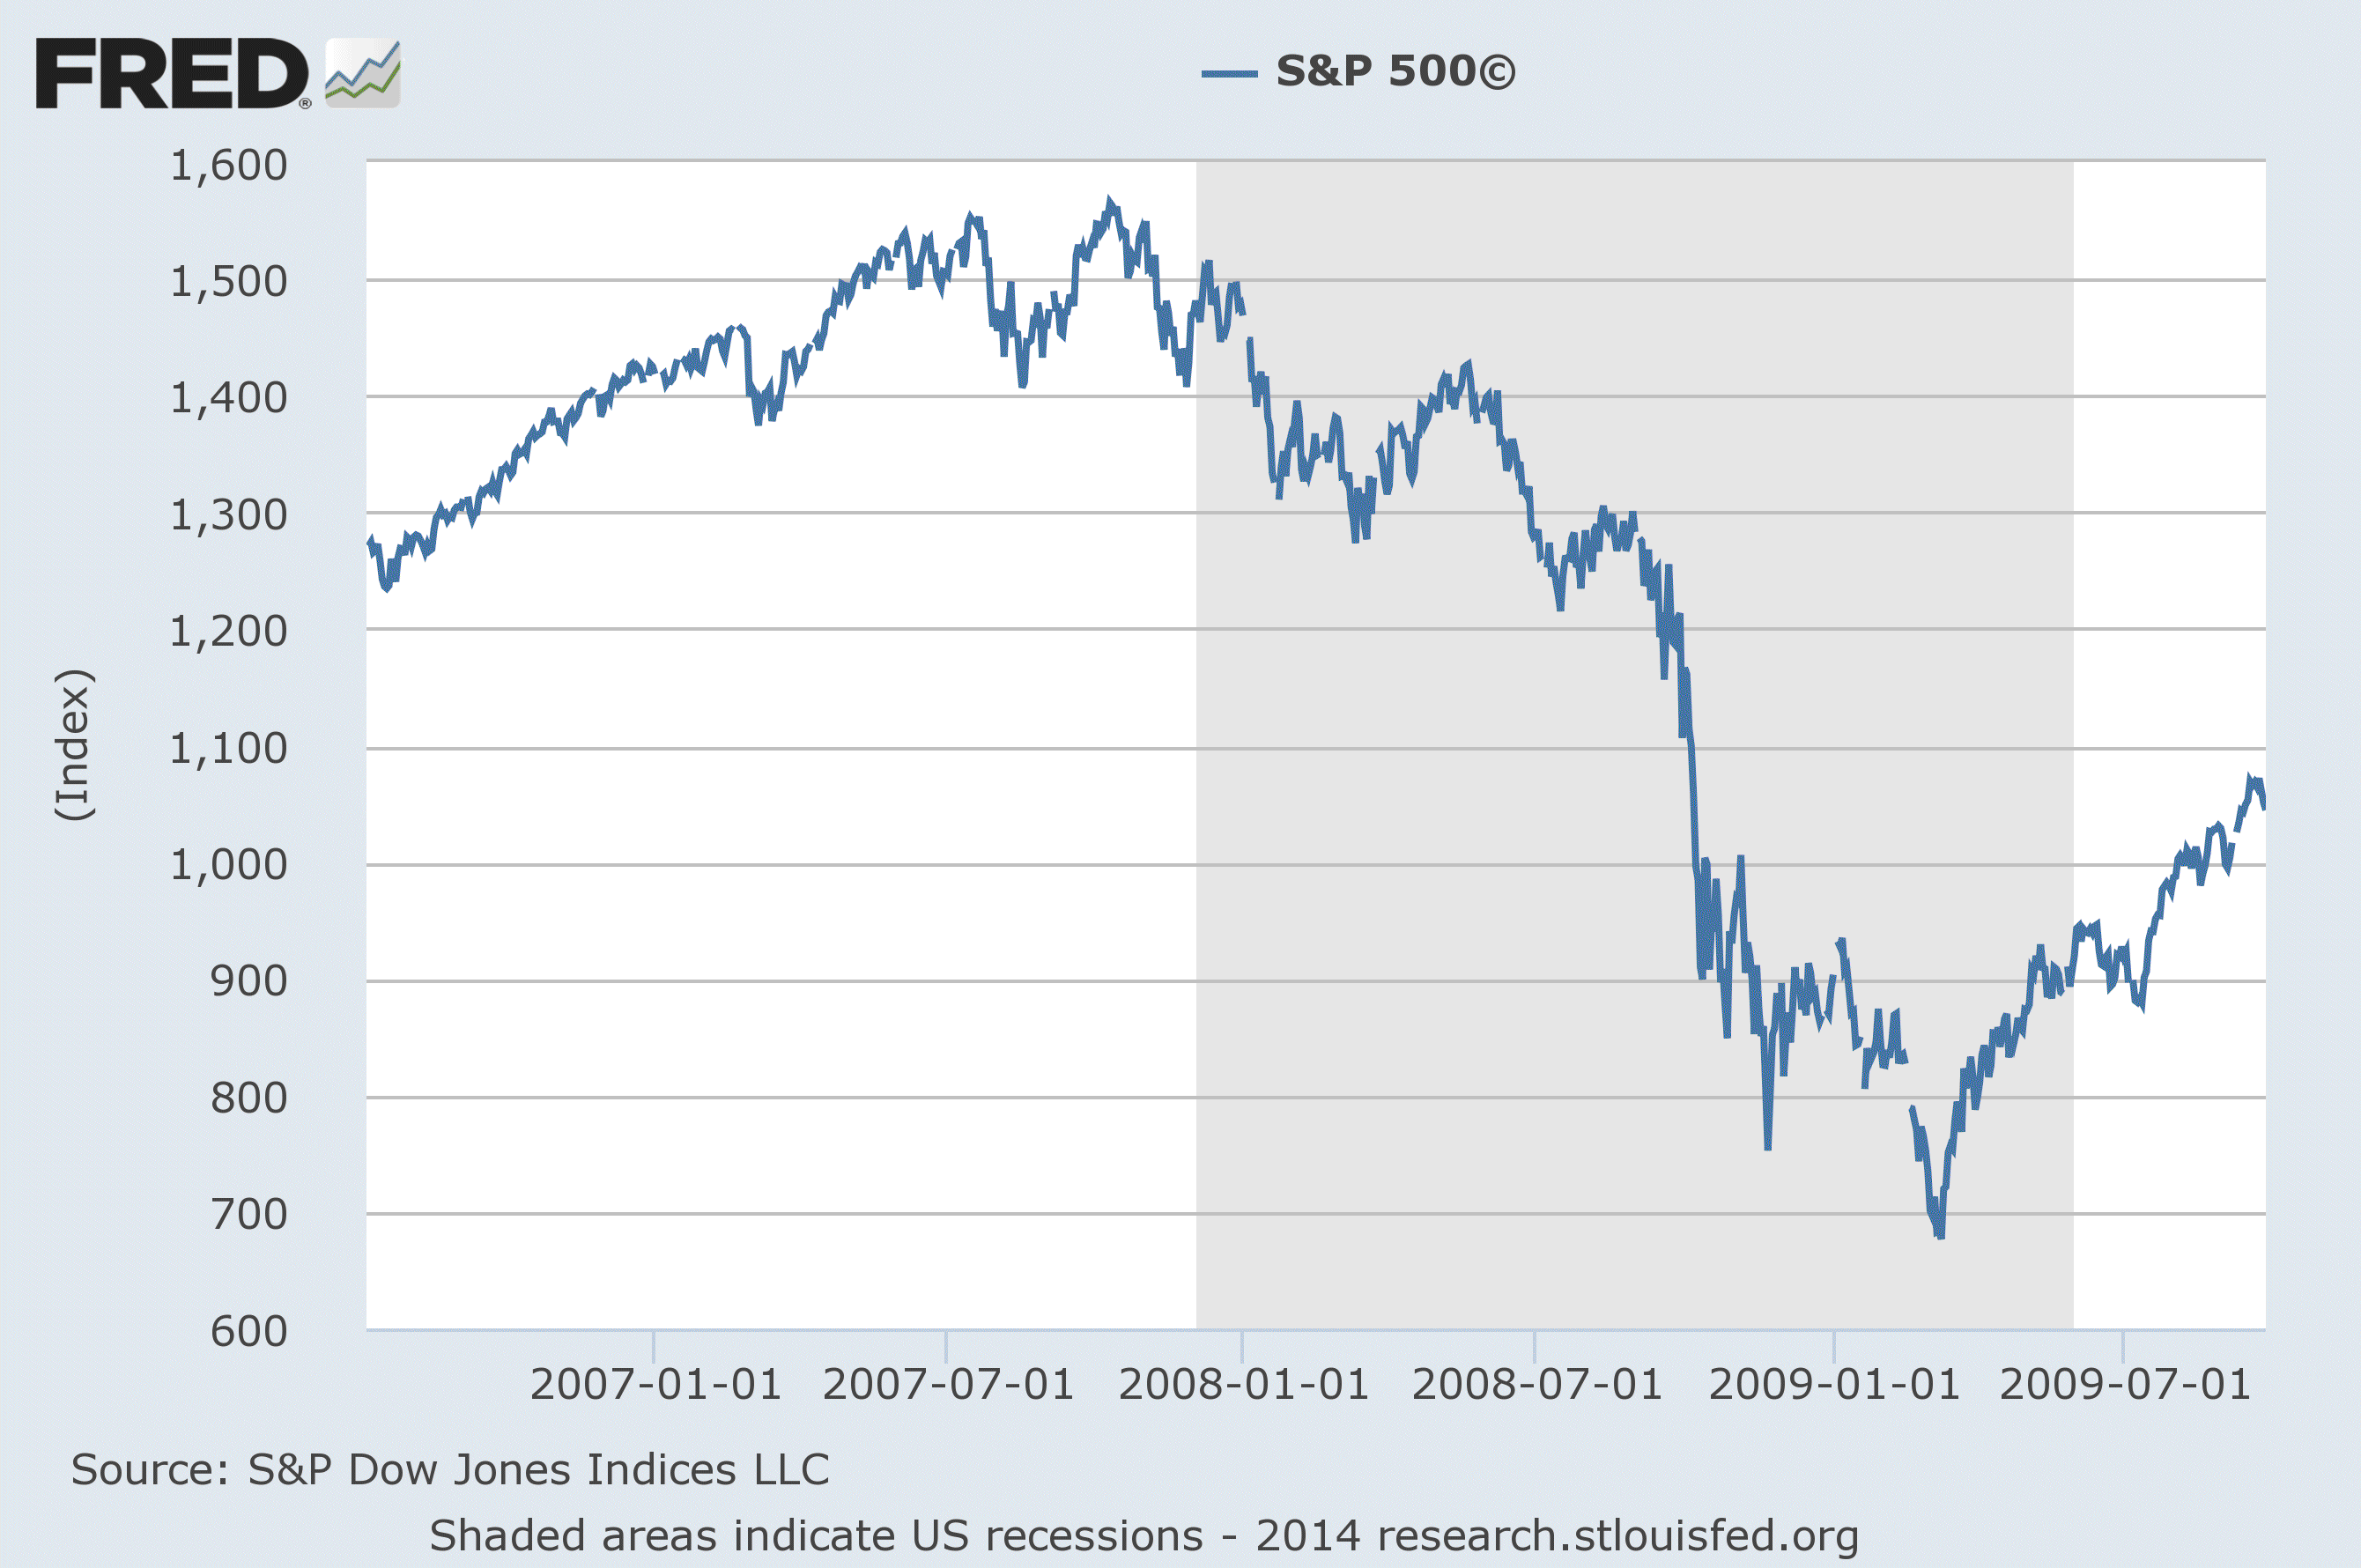
It all looks obvious now, but optimism was still the dominant view as that fateful year opened. For perspective, here’s how the S&P 500 looked during this period. Note that while the equity market in early 2008 was off its recent highs, casual observation still left plenty of room for thinking that all was well. HMM was telling us otherwise in the early weeks of 2008, offering an advance warning of the trouble to come.

The idea that HMM can work well on an out-of-sample basis isn’t unusual. Indeed, a recent study finds encouraging results on this front (“Regime Shifts: Implications for Dynamic Strategies,” by M. Kritzman, et al., Financial Analysts Journal, May/June 2012). No big surprise, then, that I’ve found similar results in my own research, such as the one test discussed above.
HMM isn’t perfect—nothing is when it comes to modeling stochastic systems such as the stock market and the economy. This is finance, not physics. But HMM is certainly worthy as one of several tools for monitoring macro and market risks.
By the way, I just ran the numbers with S&P data through Thursday, June 19, 2014, and HMM says that the bull market regime is still in force. Nothing lasts forever, of course, and so this analysis is subject to change, and perhaps sooner than the crowd assumes. When will the regime shift? No one knows for sure. But in the search for an early warning, I expect that HMM will drop an early clue.
