Volatility Warning Signs
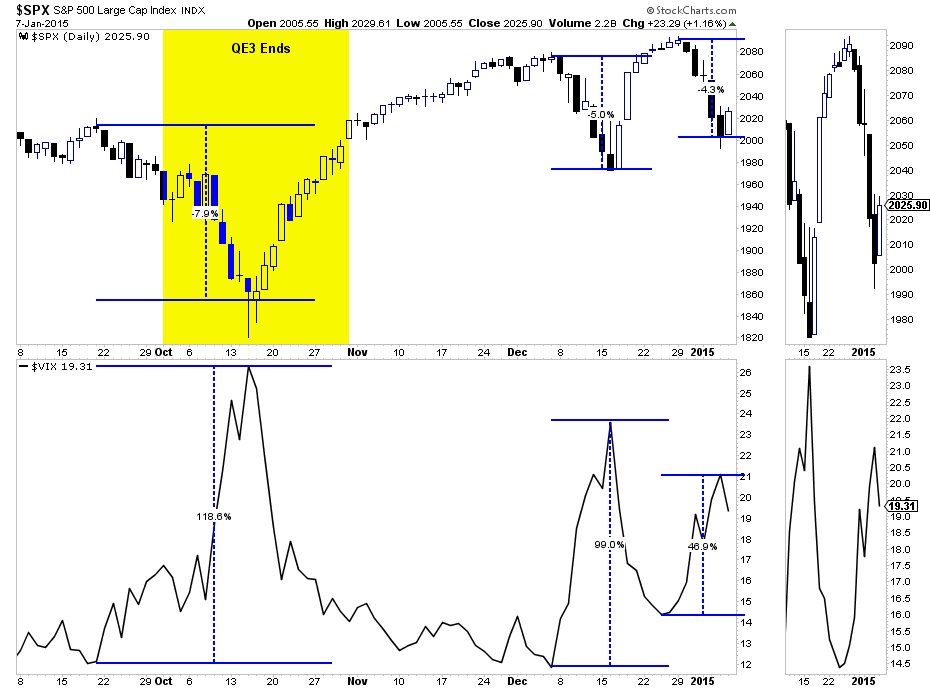
Since the end of the Federal Reserve's latest QE program, market volatility has picked up markedly. Since October, as QE came to its final bond buying conclusion, the drain of liquidity begin to financial market activity. As shown in the chart below, there have been three fairly sizable selloffs last quarter of 7.9%, 5.0%, and 4.3%.

Not surprisingly, those selloffs gave birth to sharp spikes in volatility of 118%, 99% and 46.9% currently.
Since the beginning of QE-3, at the end of 2012, the financial markets have been on a seemingly unstoppable rise. While virtually 100% of all economists, analysts, and financial bloggers are currently expecting a continuous rise in asset prices for several more years, the one constant has been a steady decline in volatility. The lack of "fear" in the financial markets has been the "sirens song" for investors to step up to the casino table and place their bets in a seemingly "can't lose" bet. Each dip has now taught investors that such moments are fleeting, and those declines are best ignored. That is a dangerous lesson, to say the least, as things may now be changing.
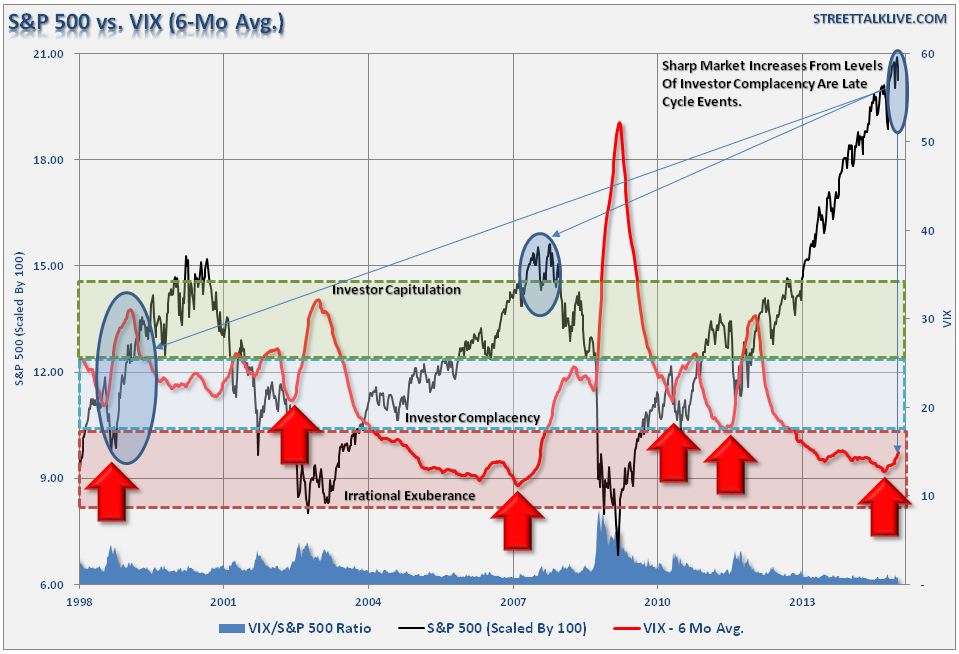
The chart below shows a 6-month average of the volatility index. By smoothing the index, we can get a clearer picture of the trend of volatility over time. As shown, the trend of volatility has been in a steady decline since the beginning of 2013 but is now showing signs of making the first turn higher since the 2011 debt-ceiling debate market rout.
As shown by the red arrows, historically the turns higher in the smoothed volatility index have either occurred near major market peaks or during major bear markets. While it is clear that we are currently NOT in a major bear market as of yet, the turn higher in volatility is a clear warning sign that the six-year bull market in equities, one of the longest uninterrupted runs in history, may be nearing its end.
Is The Fed Still Saving Your Bacon?
Speaking of these successive V-shaped, "Buy The Dip", market corrections as of late, it really isn't something new. Ever since the beginning of 2013, the financial markets have steadily "bounced" their way higher with seemingly each sell-off being magically lifted off support just before real "panic" set in. Is that just a coincidence? Maybe not?
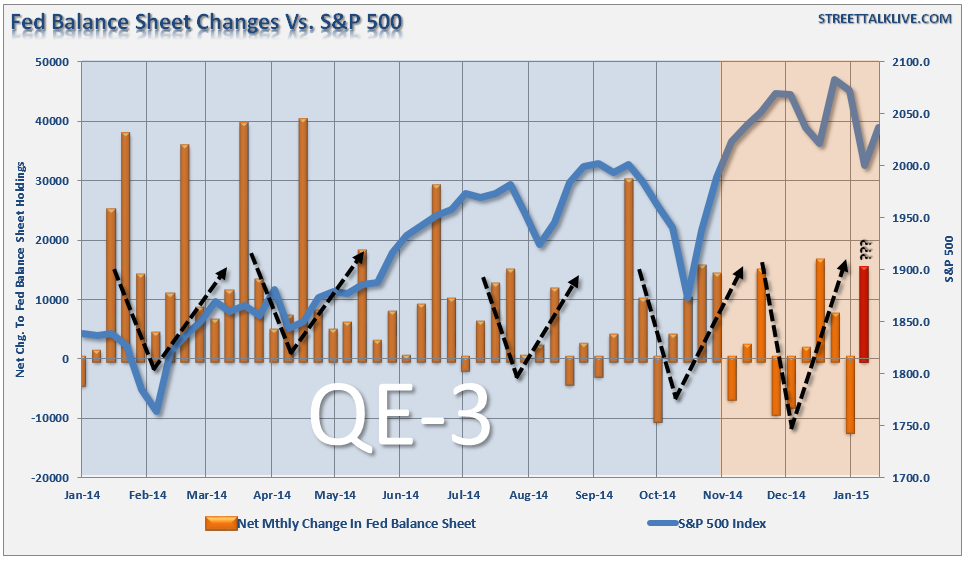
The chart below is the weekly changes the Federal Reserve's balance sheet. As shown, each "V-shaped" action in equities has been marked by a relative decline, and subsequent surge, in assets on the Fed's balance sheet.
While the latest weekly change has not been published yet, I have noted an "estimated change" in balance sheet assets (red vertical bar) that would coincide with the last "ramp recovery" in the markets following the end of December and early January sell-off.
There is little doubt that the Federal Reserve has a vested interest in ensuring that financial markets continue to move higher as consumer confidence is critically important to keep the global deflationary pressures at bay. The danger, of course, is that continuing to increase the deviation in asset prices from long-term trends, as discussed recently, leads to terrible outcomes. Of course, it is "different this time," right?
Yield Spread Is Falling
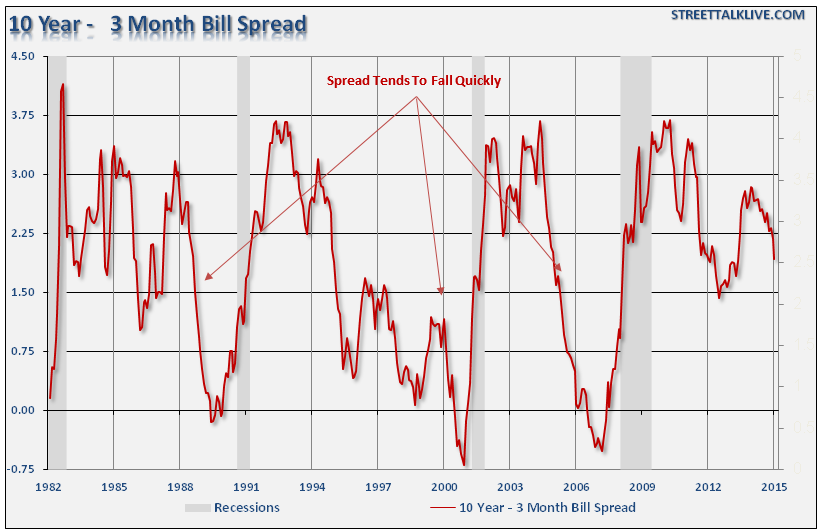
One of the arguments used to support the ongoing bull market in equities has been the yield curve. As long as the yield curve is not inverted there is absolutely no danger of a recession, and therefore you should be long equities. The chart below shows the spread between the 10-year and 3-Month Treasury bonds.
As you can clearly see, the analysis is correct. There has not been a recession when the spread between these two interest rates is positive. However, here is the problem -- yield spreads tend to fall extremely quickly.
As of the close yesterday, the interest rate on the 10-year bond was a 1.95%. With the continuing rise of the US Dollar relative to the Eurozone and Japan, I fully expect that interest rates could fall very close to 1% this year. With the Federal Reserve threatening to start increasing interest rates in the next few months, it will not take much to push the yield spread close to zero.
While portfolios should currently be weighted towards equities, as the long-term bullish trend remains intact, it is important to remember that the supportive underpinnings are deteriorating. Valuations are elevated, bullishness and complacency are high, and deviations are at extremes. The combination of these ingredients has never led to a profitable conclusion and expecting a different outcome this time will likely lead to excessive disappointment.


